
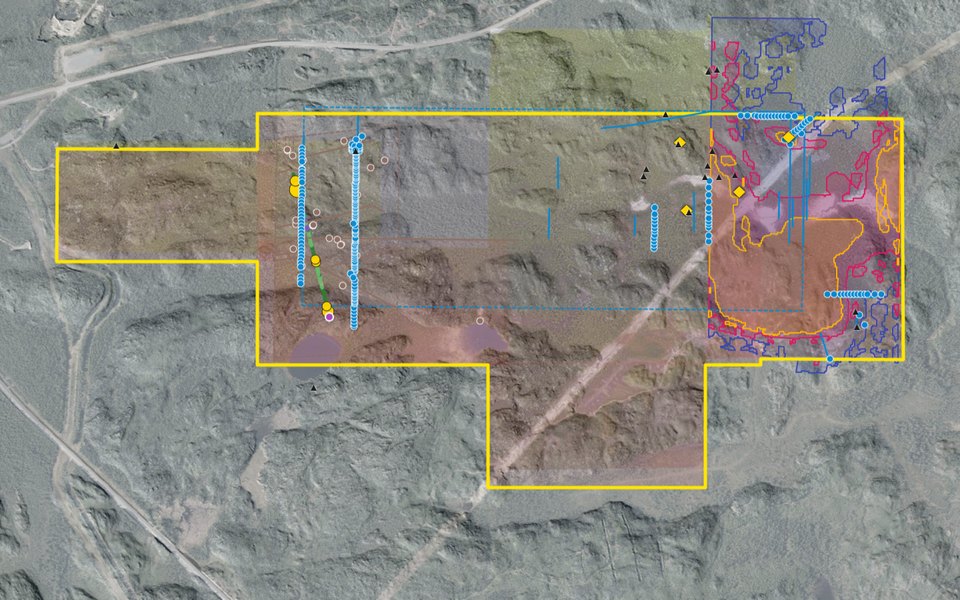
2D map
Claims and leases, showings, samples, drill holes and survey grids on the 10 cm drone photos and 1 m LiDAR. North is always up.
Every claim, showing, sample and survey – in 2D, 3D, on the geology map and, for investors, as line sections
Open the Property Viewer 90-second tour Apply to be an investor
Everything we hold on the Eby–Otto property is in one viewer that runs in your browser – no software to install. Each button below opens the viewer in exactly the view described, so you can see the feature for yourself. Features marked Investors unlock when you become an investor.
One place, four ways to look at it. The switch on the left of the viewer keeps your place when you change view.
Claims and leases, showings, samples, drill holes and survey grids on the 10 cm drone photos and 1 m LiDAR. North is always up.
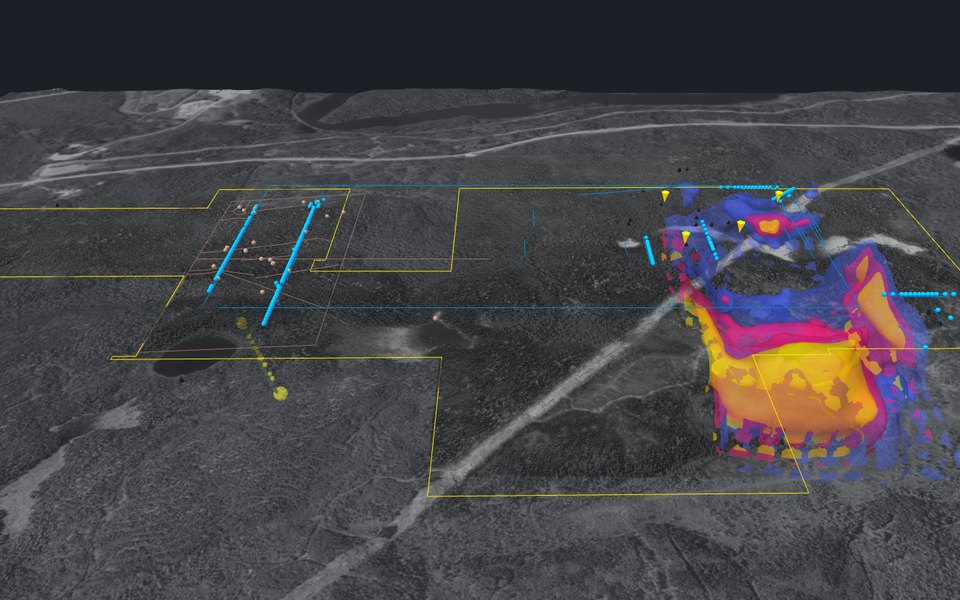
Fly over the LiDAR ground and look beneath it: the magnetic body under the Reed showing, the 2022 IP survey and hole EO-22-004.
The 1:1000 field geology mapped by Doug Robinson and J. Reed in 1994–96, digitised: outcrops coloured by rock unit.
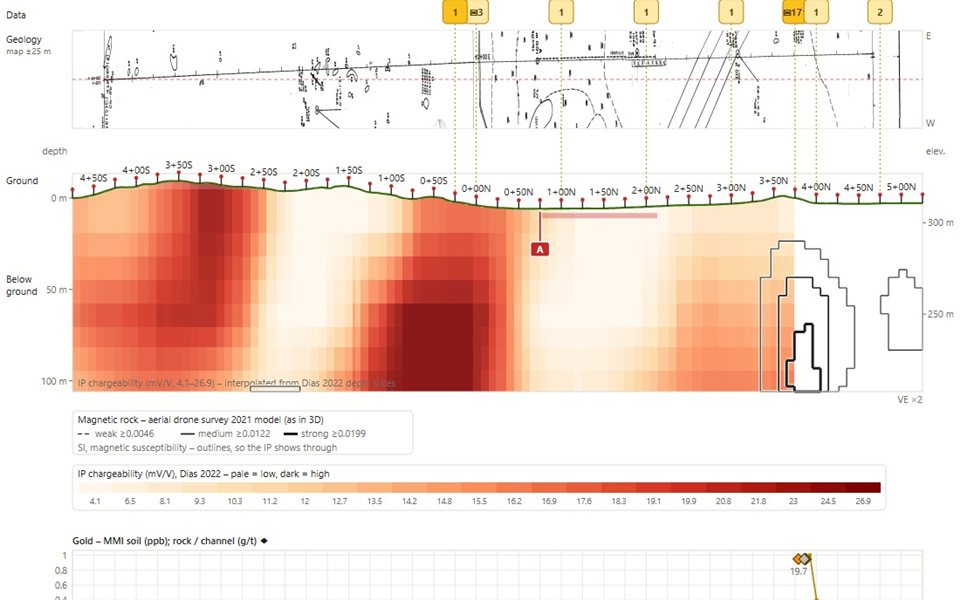
Any grid line as a cross-section: the ground and pickets, drone and ground magnetics, IP below and gold assays, all lined up.
Short, captioned tours that move the viewer for you – the 90-second tour, the investor tour, drilling and each showing. Space pauses, arrows step.
Our 10 claims and 5 leases (about 285 ha) among Stardust Metal, Agnico Eagle and Barrick Gold.
The Reed showing, Reed trench, G, S and R veins, with the stripped veins and surface samples around them.
The camp's mines, the breaks and Amikougami Creek – where the property sits in a 23-million-ounce gold camp.
The aerial drone magnetic map, with the sharp east-trending break along the Reed showing.
The 3D model of the drone magnetics: a strong magnetic body starts right under the Reed showing, about 50–120 m down.
Set a depth and the map shows that slice: the 2022 IP survey at 220 m here, or a cut through the 3D model.
Investors can drag the depth slider; the public link shows a fixed depth.
Click any empty spot on the 2D map – or the last line of a pop-up – and one card says what every survey shows there: the grid station, the magnetic model's body and its depth, the IP value at the depth you've set and the nearest EM conductor.
Investors also see the nearest ground-magnetic and MaxMin readings, and can open the line in 1D.
Every recorded hole: the 1984 holes and the 969 m hole EO-22-004, with the trails and drill pads still in place.
Highways 11 and 66, the railway, the Hydro One line, water, and the trails and pads from 2022.
The 1994–96 cut grid and pickets that all the old field work sits on, and a 500 m UTM grid.
Step year by year through the assessment work filed since 1994 and see where each program was done.
The address bar always holds the exact view – place, layers, selection and depth. Copy it and send it to a colleague.
Investors see the full data set under a confidentiality agreement. These buttons work once you're an investor.
Spots where five kinds of survey evidence agree, ranked and stepped through one by one, each with its reason.
Doug Robinson's proposed holes and the first-phase plan, on the map and in 3D.
45,818 Walkmag readings, one every 2 m along the cut grid.
All rock, channel and soil samples, high and low, with their lab results.
Hole EO-22-004 down the hole – rock types, gold and XRF – beside the line it sits on.
The whole layer list, search, saved views, split screen (2D beside 1D or 3D), the depth slider, 3D cuts and click-for-details on everything.
Assessment reports, survey data, maps and the technical brief.
Targets, proposed holes, every assay, the line sections and the data room. Tell us who you are – it takes a minute.
Everyone gets the four views' public layers, the tours and every "Try it" link on this page. Investors also get the layer list and tools, the 1D line sections, click-for-details on everything, the targets, proposed holes, every assay and the data room. Apply to be an investor.
Positions come from GNSS surveys (about ±0.5 m at the showings), the Ontario drill-hole database and digitised field maps, which are approximate – the viewer says so where it matters. Most results are historical and not verified by a Qualified Person. See legal and disclaimer.
Use the ? Ask button (bottom right of any page, or in the viewer's left bar) to ask the owners anything about the property or the viewer. Good questions and their answers go here.
| Key | What it does |
|---|---|
| + / −, Page Up / Down | Zoom |
| Arrow keys | Slide the map (3D: Ctrl or Shift + ← → turns, ↑ ↓ tilts) |
| 0 | Centre on the property |
| 1 2 3 4 | 1D (investors), 2D, 3D, Geology |
| F | Full screen |
| Space, ← →, 1–9 | During a tour: pause, step, jump to a stop |
| L, /, S | Layers, search, split screen (investors) |
| [ ], A, C | Previous / next grid line, next direction, compare a line (investors) |
| Esc | Close a pop-up, then clear the selection |
| ? | Show all the keys |
The guided 3D tour as a short video – for a quick look or to show in a meeting. We update it as new work is added.
Kirkland Gold is an independent prospector partnership. The Eby–Otto property is open to an investor.
Apply to be an investor Talk to us Request a site visit