KirklandGold.com – The 2nd Mile Property Viewer

Forty years of geophysics

Geophysical technology has changed enormously over our ownership of these claims. Here is every survey we hold, oldest first, each with a picture of its actual results. The 1D profile, 2D map and 3D map buttons open the Property Viewer in that view, with the survey switched on and the line through the Reed showing chosen.

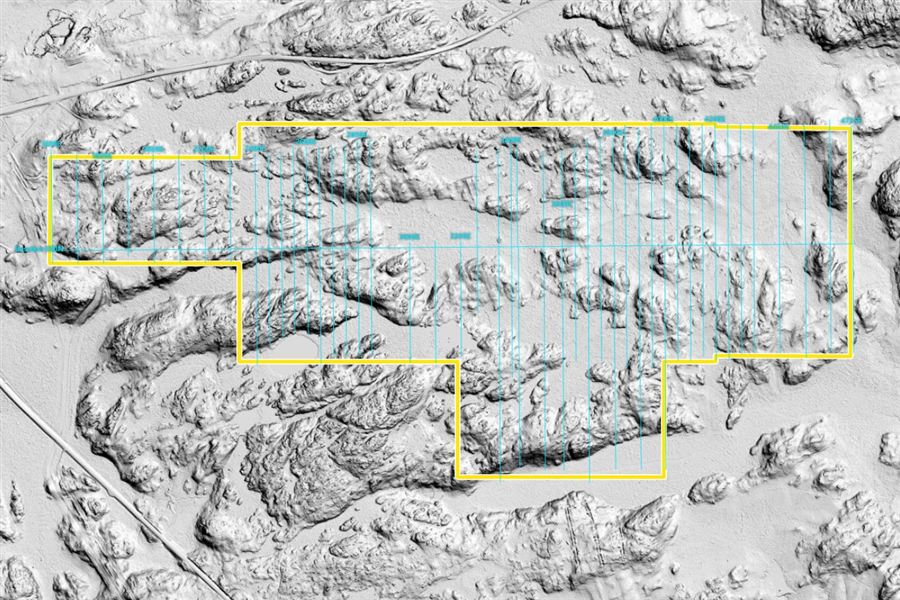
Walk magnetics, 1994–96 – 2D · the 1994–96 survey grid (results: investors)2D · the 1994–96 survey grid (results: investors)
Ground magnetics (Scintrex Walkmag)

Walk magnetics, 1994–96

Area
The whole property, on the cut grid lines (Reed grid)
Data
45,818 total-field readings, one every 2 m
By
Doug Robinson, P.Eng.; J. Reed

Doug Robinson ran the Walkmag here with a reading every two metres – far closer than the line surveys of the day.

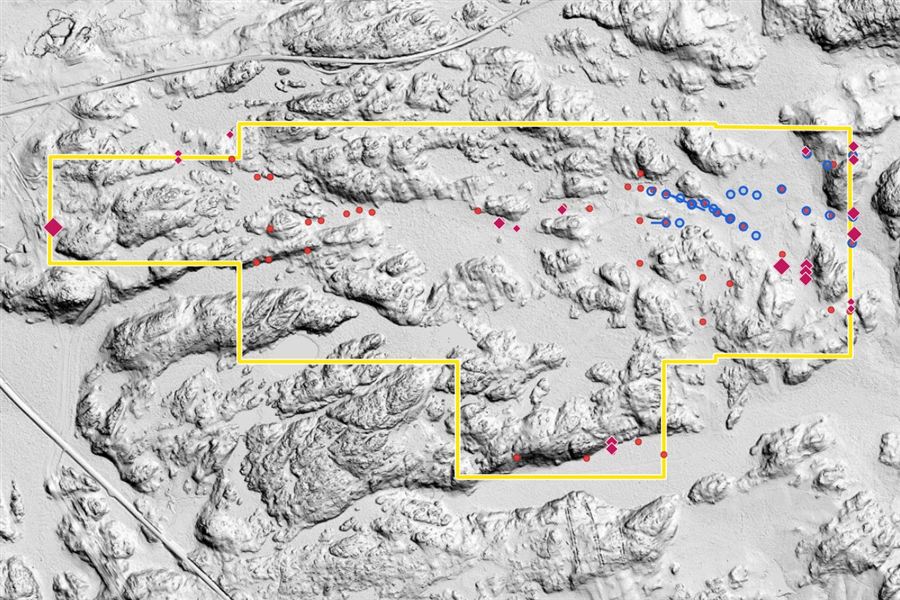
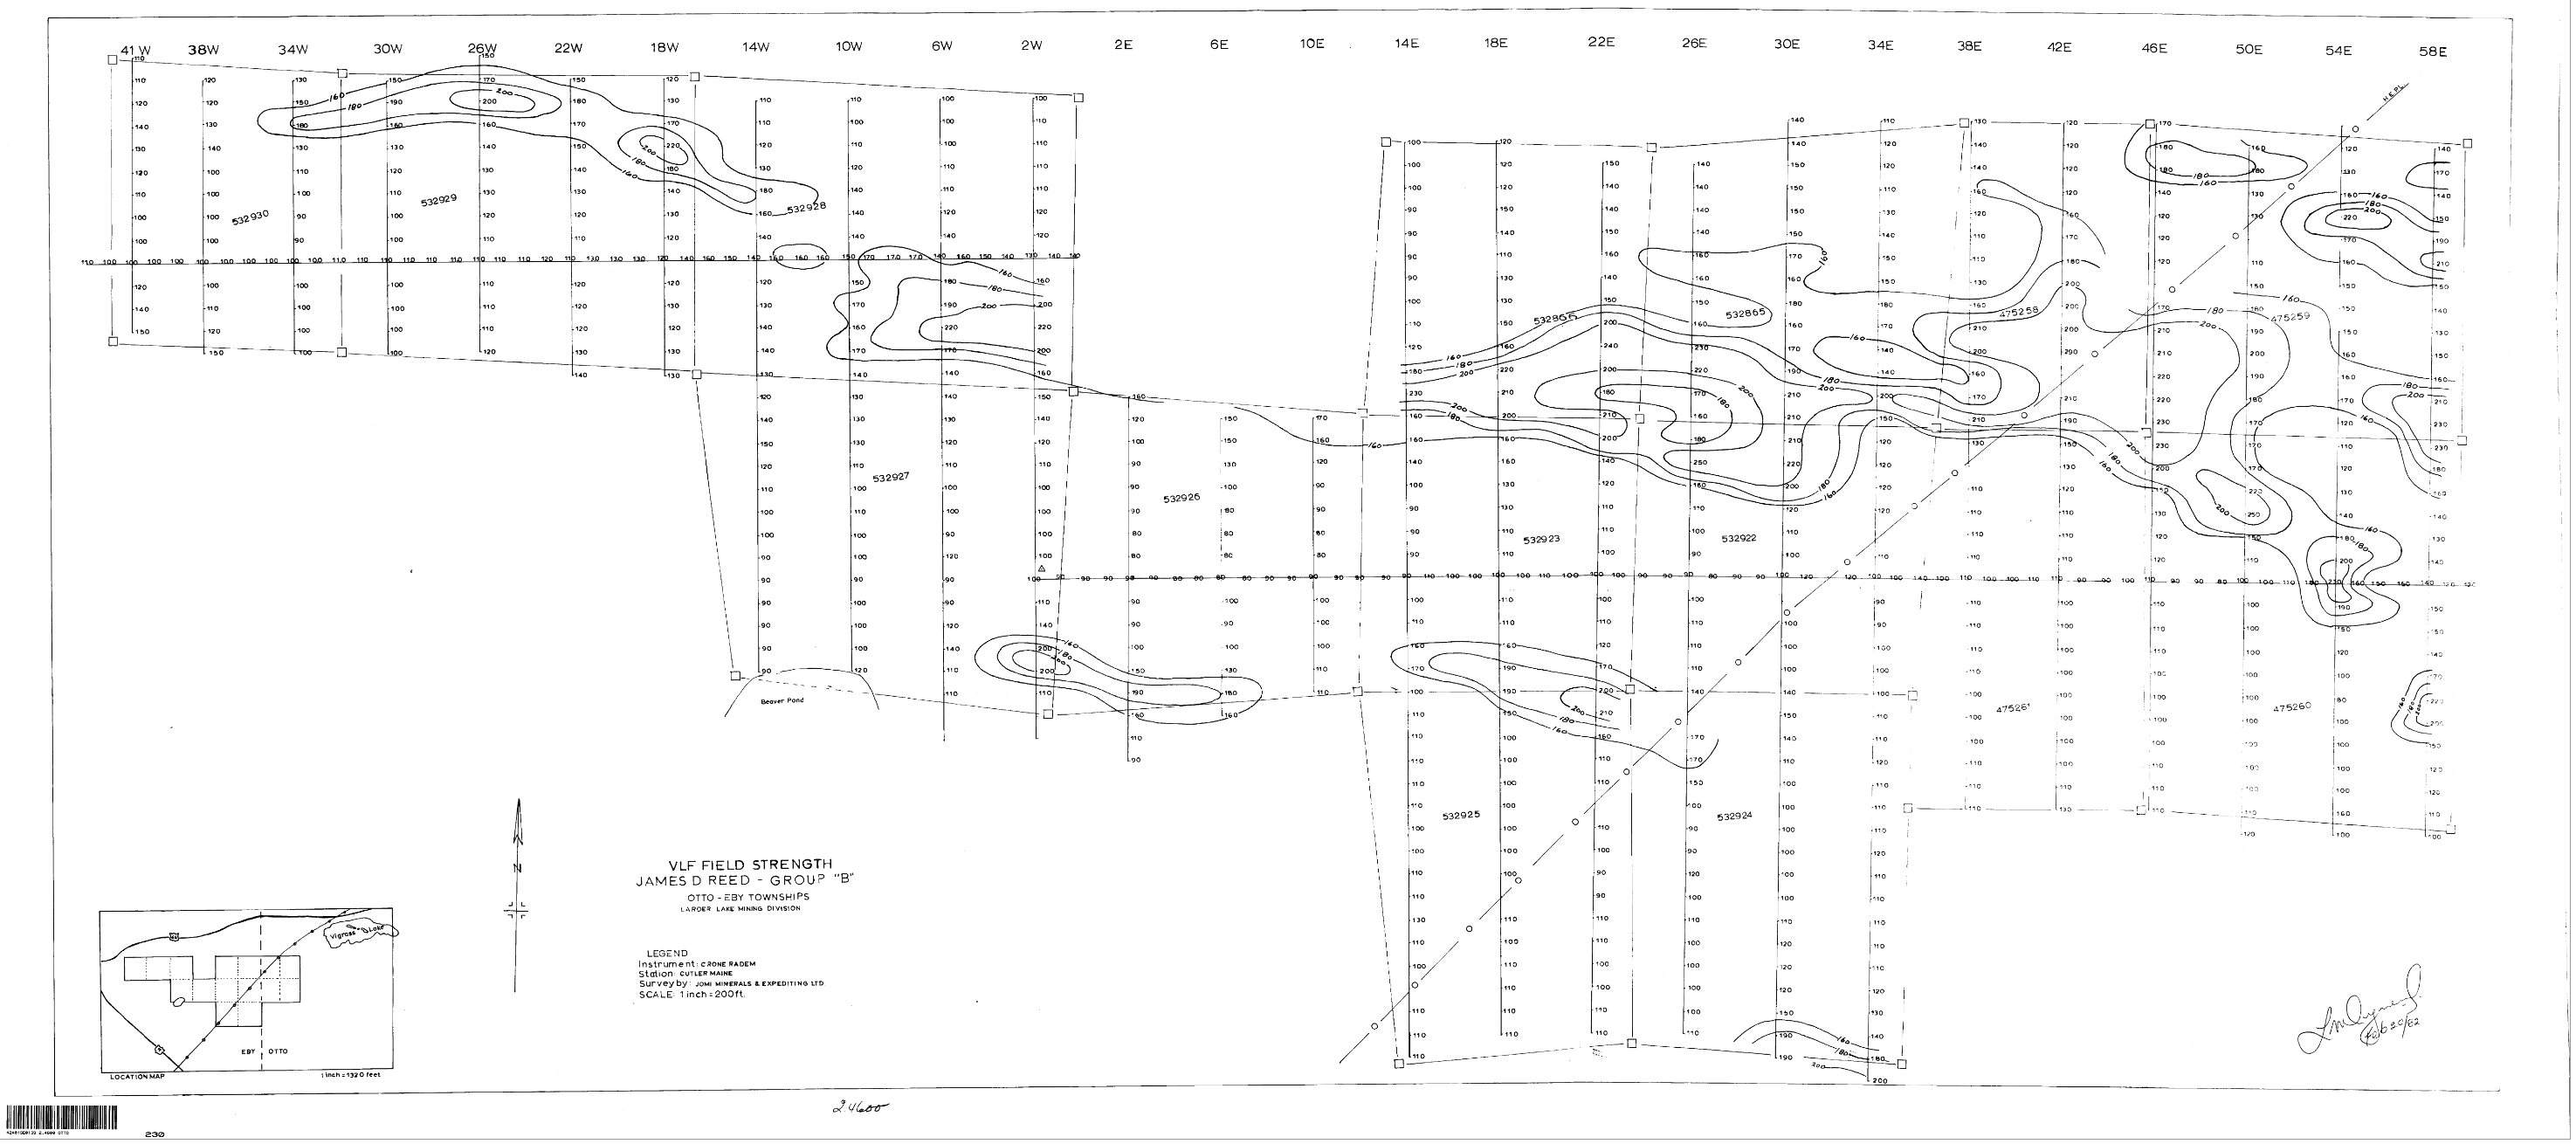
MaxMin EM, 1994 and 1996 – 2D · EM conductors on the LiDAR ground model2D · EM conductors on the LiDAR ground model
Ground EM (horizontal-loop MaxMin)

MaxMin EM, 1994 and 1996

Area
The grid over the property; about 17 line-km in 1996
Data
1994: Apex MaxMin I-9 at three or more frequencies. 1996: MaxMin II at 888 and 3555 Hz (Nastek Explorations). 3,255 readings in the database

Horizontal-loop EM picks out conductors – sulphides, or graphite along a shear. The 1995 reference maps put them together with the geology, float and pits.

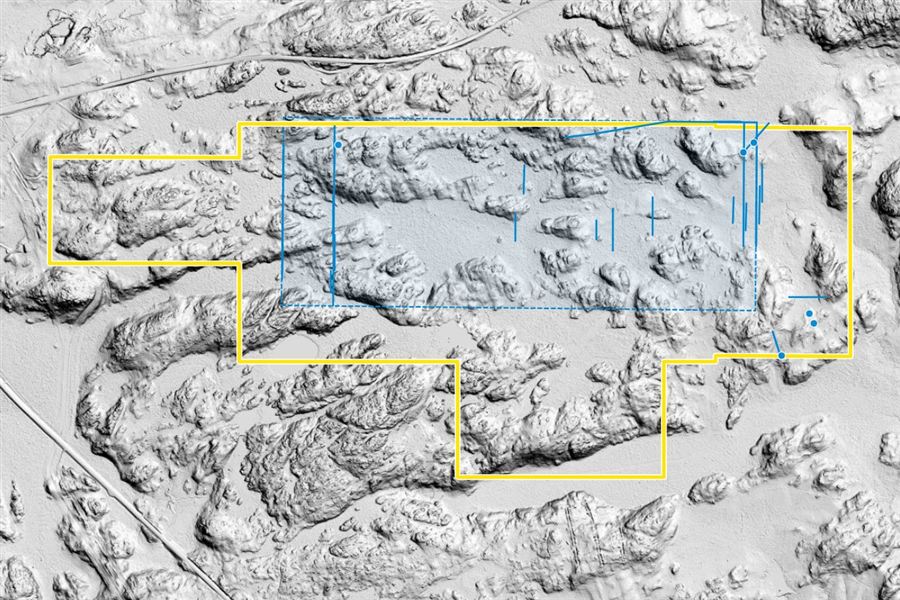
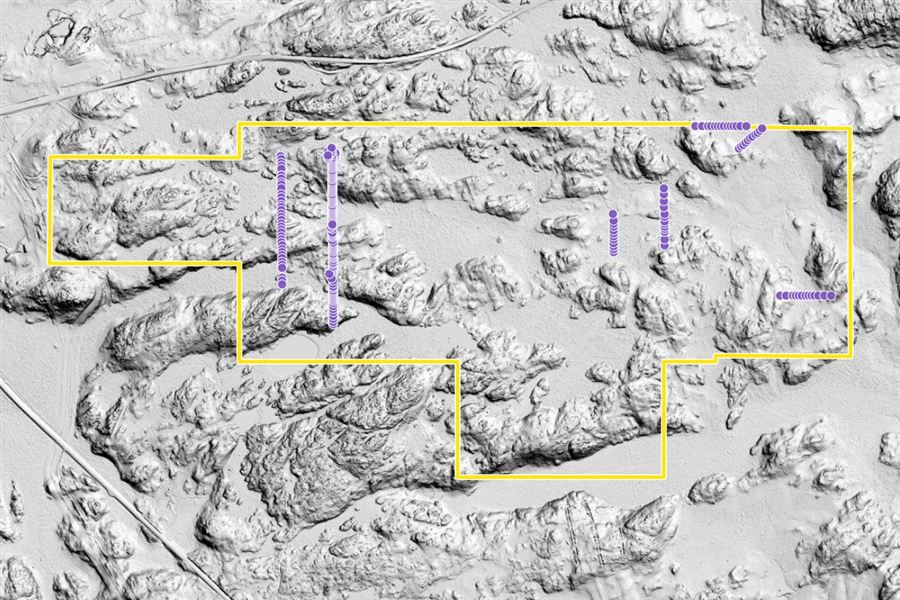
Magnetic line profiles, 2010–11 – 2D · where the 2011 lines were cut2D · where the 2011 lines were cut
Ground magnetics · line-cutting

Magnetic line profiles, 2010–11

Area
New cut lines over part of the property
By
Doug Robinson, P.Eng.

Line-cutting and magnetometer profiles, filed for assessment credit.

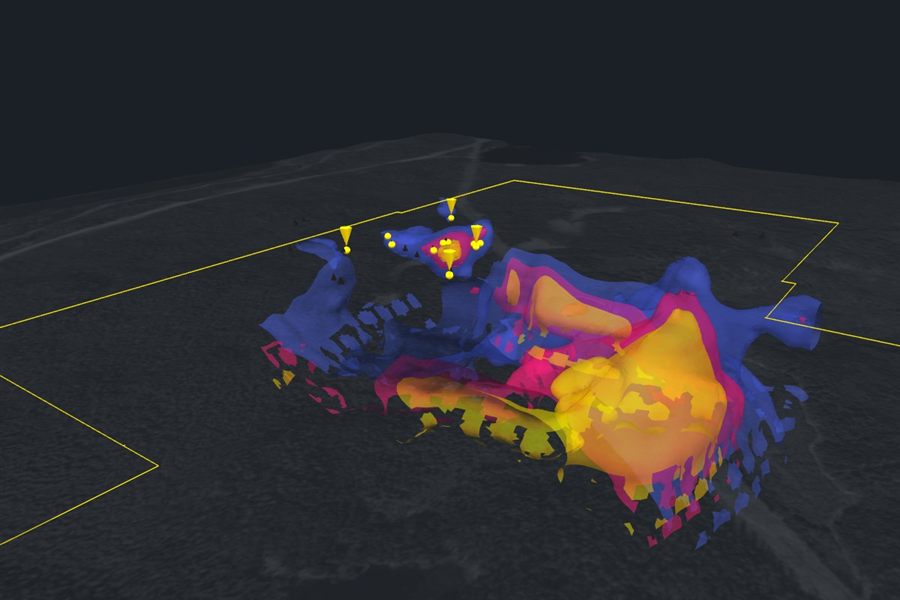
Drone magnetics, 2021 – 3D · magnetic bodies from the 2021 model3D · magnetic bodies from the 2021 model
Airborne magnetics (Aerial drone)

Drone magnetics, 2021

Area
Eastern part of the property
Data
44 lines at 12.5–25 m spacing; 49,645 readings; 3D inversion (the Aerial drone model)
By
Report: EarthEx (D. Card, P.Geo.)

A sharp east-trending magnetic break, with the Reed showing on its southern margin and a strong magnetic source beginning right at the showing.

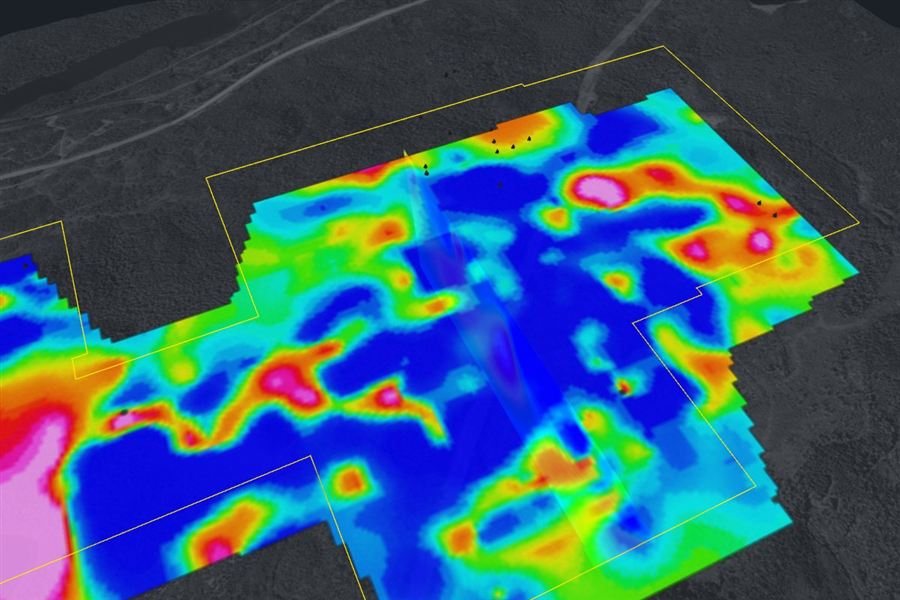
IP survey, 2022 – 3D · chargeability, 2022 inversion3D · chargeability, 2022 inversion
3D DC resistivity / induced polarisation

IP survey, 2022

Area
Most of the property
By
Dias Geophysical, for the previous optionee

High chargeability (red and pink) often marks disseminated sulphides, which carry the gold in this camp. Chargeability and resistivity can be sliced at any depth.

Related surveys

MMI soils, 2012–13 and 2016–18 – 2D · the 207 soil samples2D · the 207 soil samples
Soil geochemistry (MMI)

MMI soils, 2012–13 and 2016–18

Area
Sample lines across the property
Data
207 soil samples
By
Doug Robinson, P.Eng.

Not geophysics, but read alongside it: mobile-metal-ion soil samples along lines over the property.

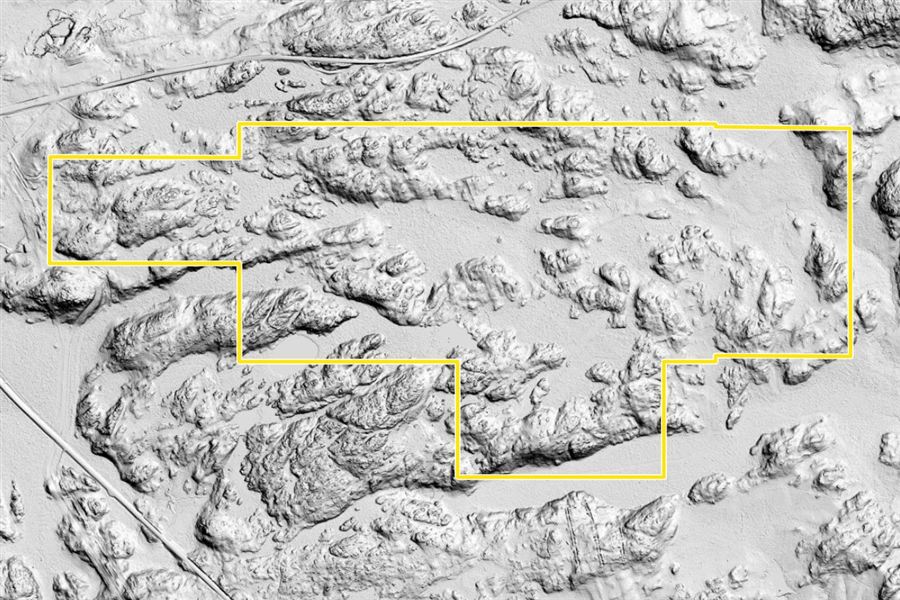
LiDAR and drone photos – 2D · LiDAR hillshade, 1 m2D · LiDAR hillshade, 1 m
Remote sensing

LiDAR and drone photos

Area
The whole property
Data
Ontario LiDAR, 1 m (2024–25); drone photo map, about 10 cm (2021)

The ground model every other survey sits on in the viewer.

Investors also see the filed assessment reports, the 1D line sections and the survey interpretations. Apply for investor access.

Invest with us

Kirkland Gold is an independent prospector partnership. The Eby–Otto property is open to an investor.

Apply to be an investor Talk to us Request a site visit
Open the Property Viewer