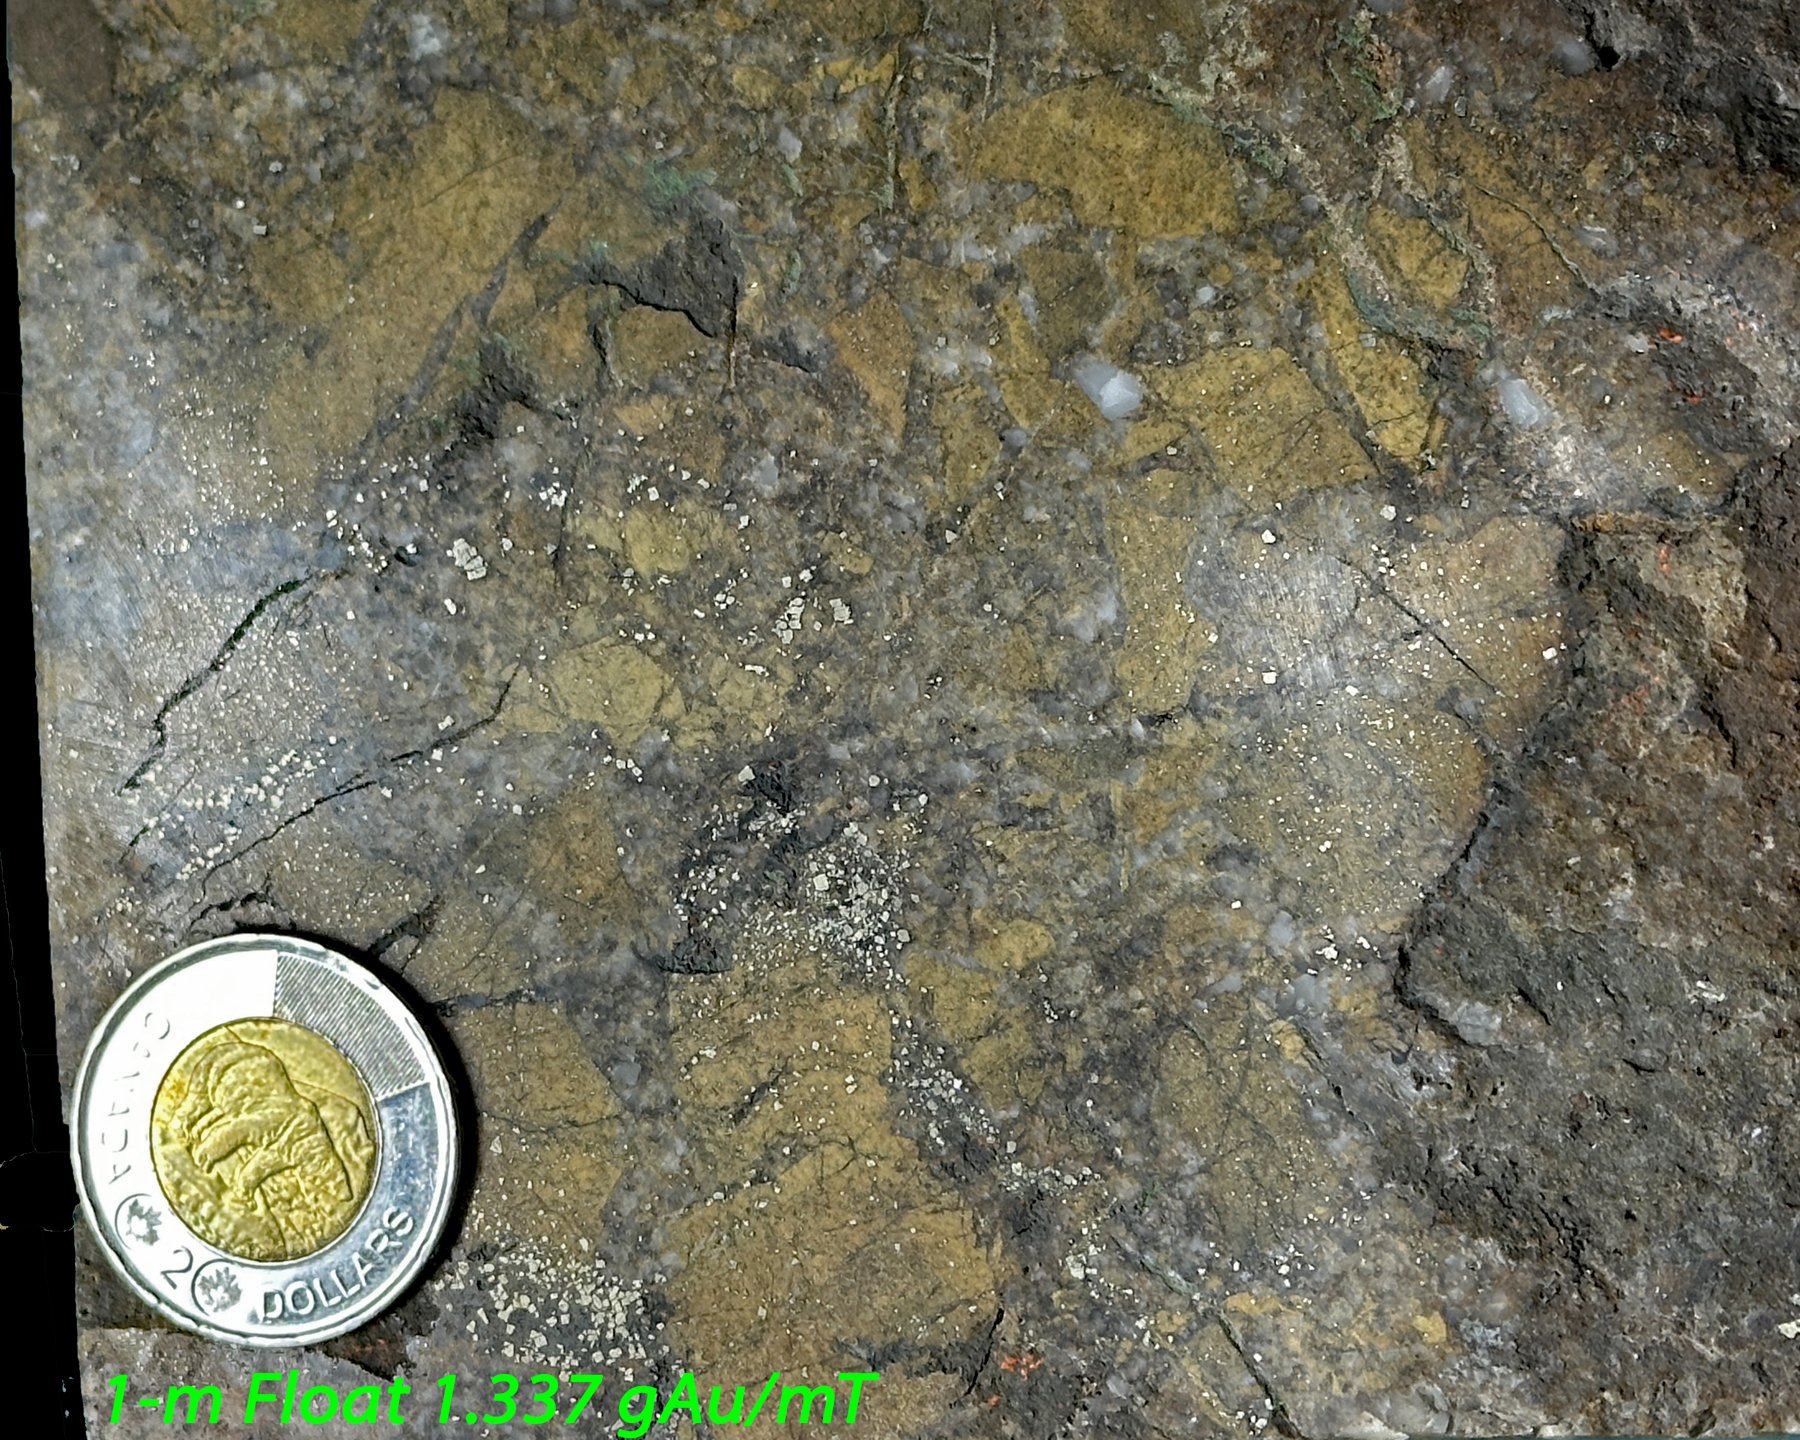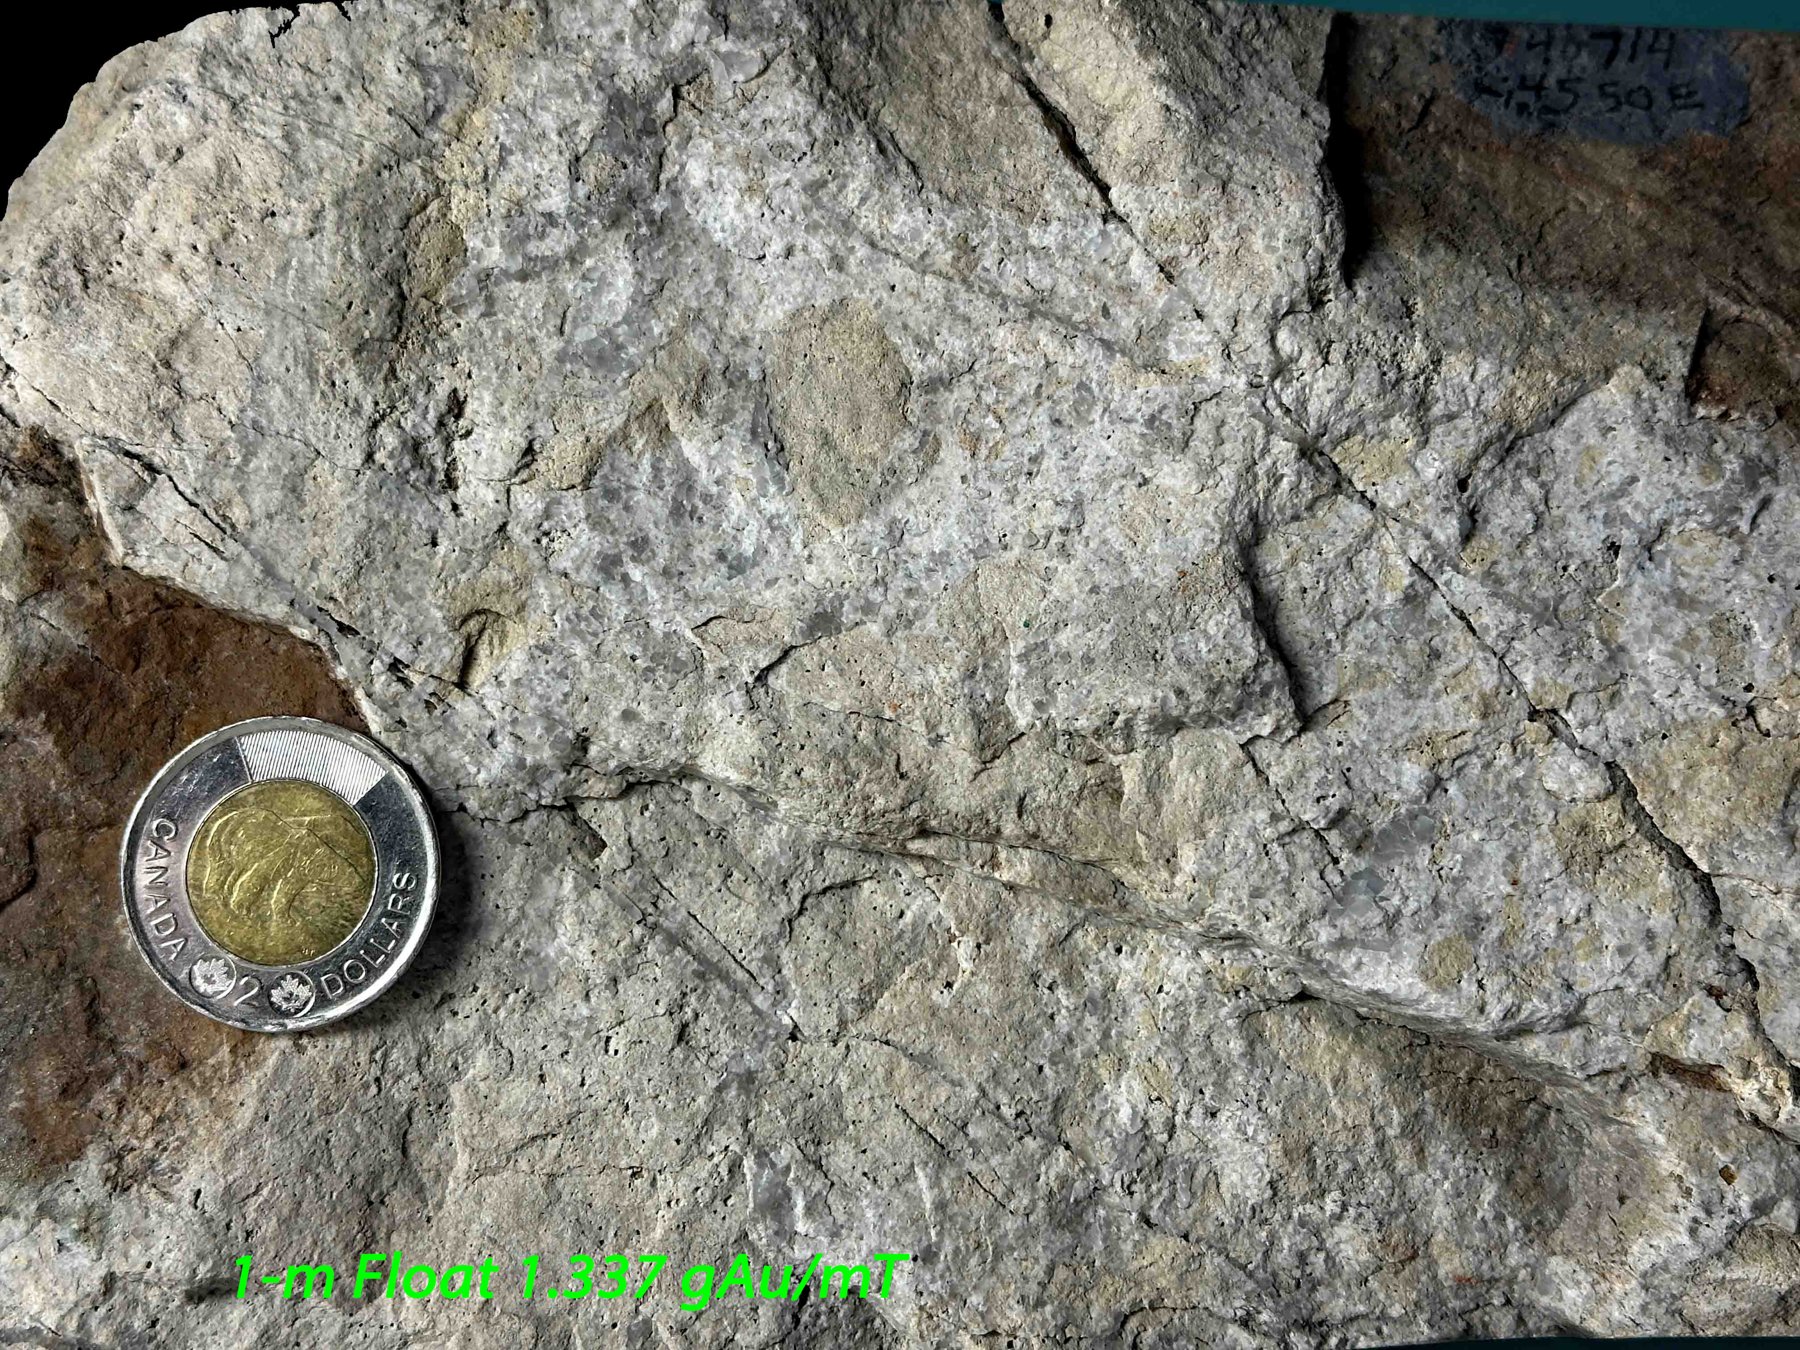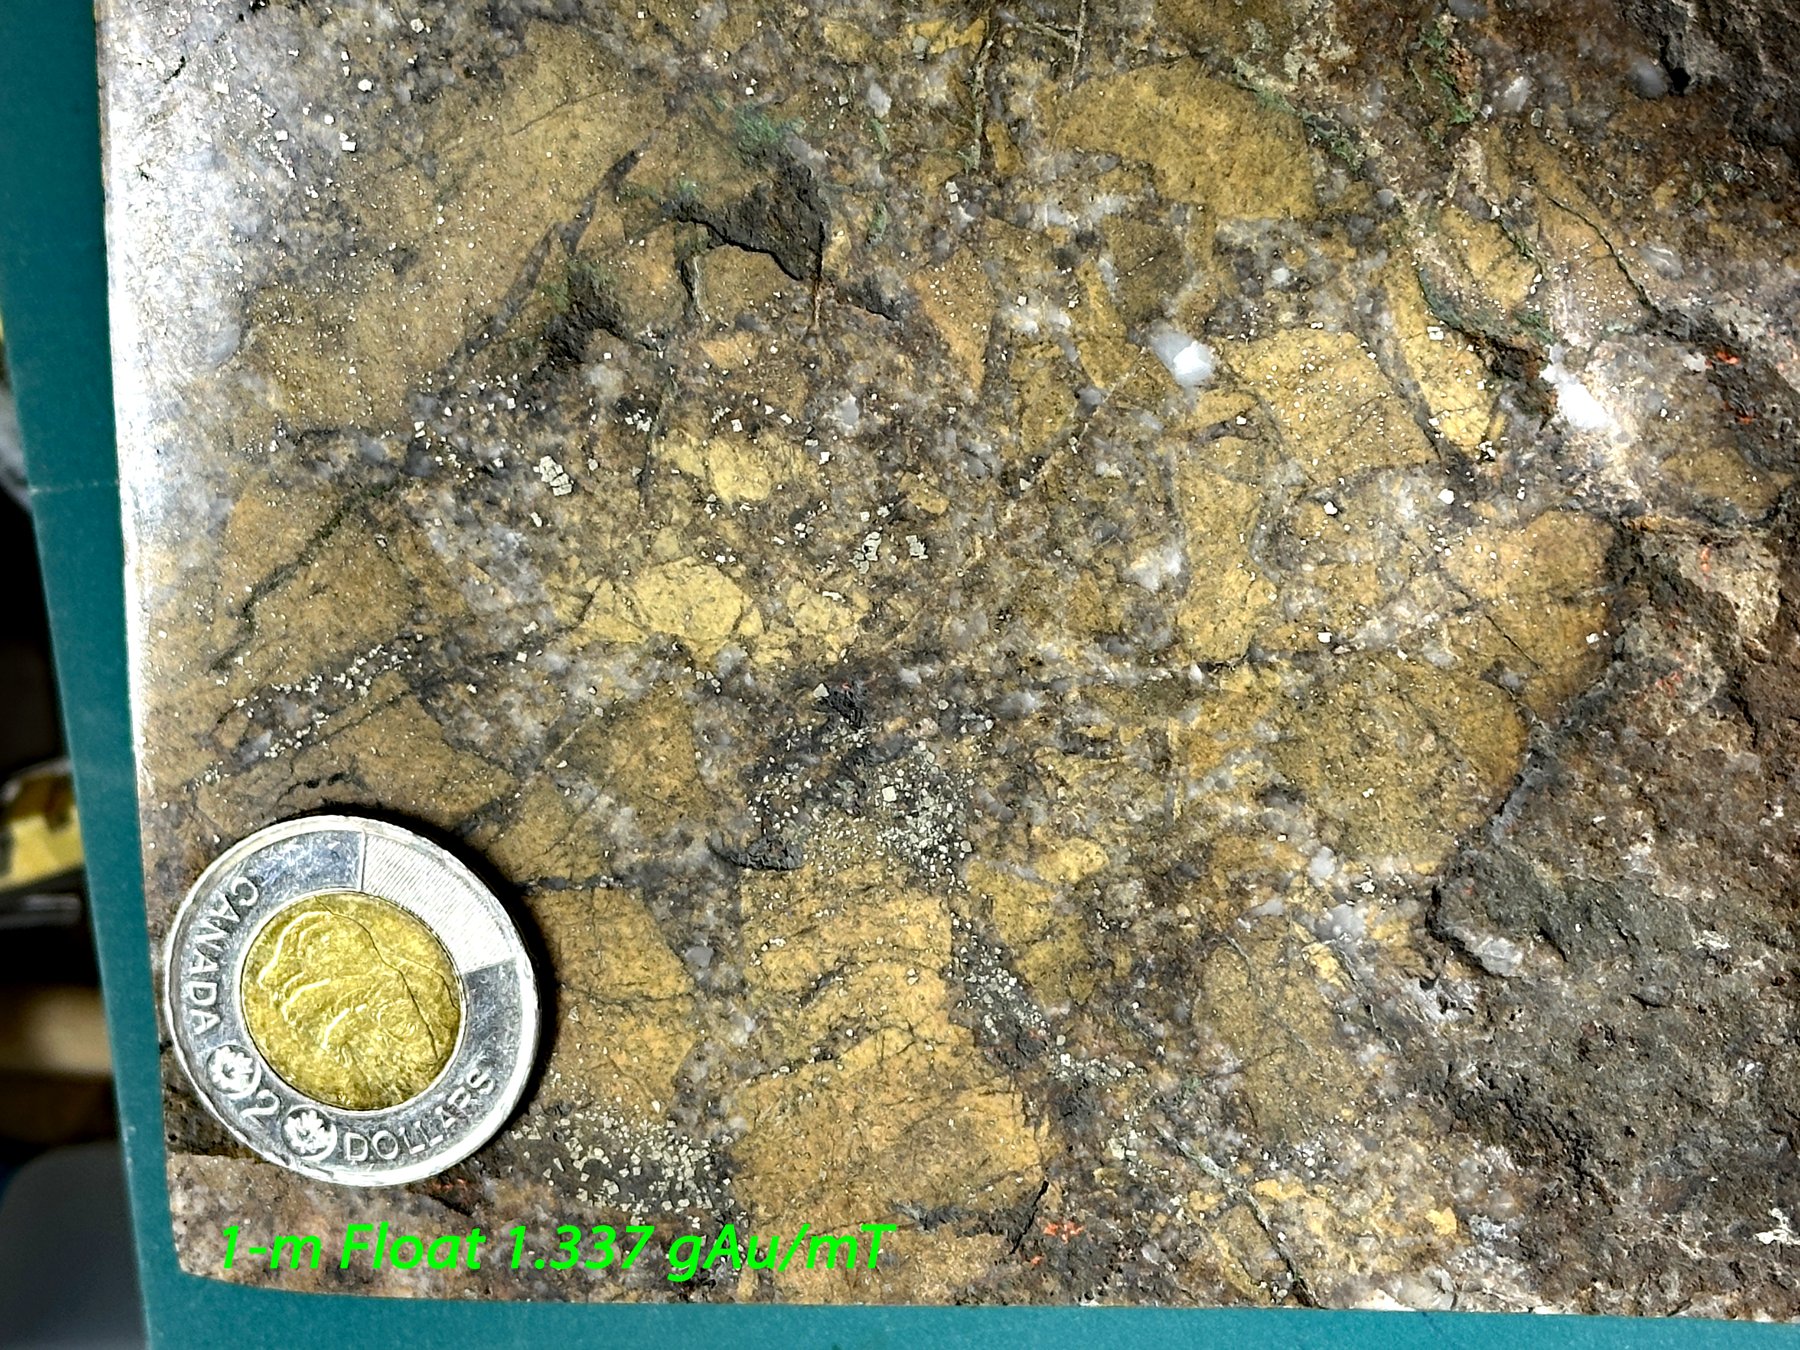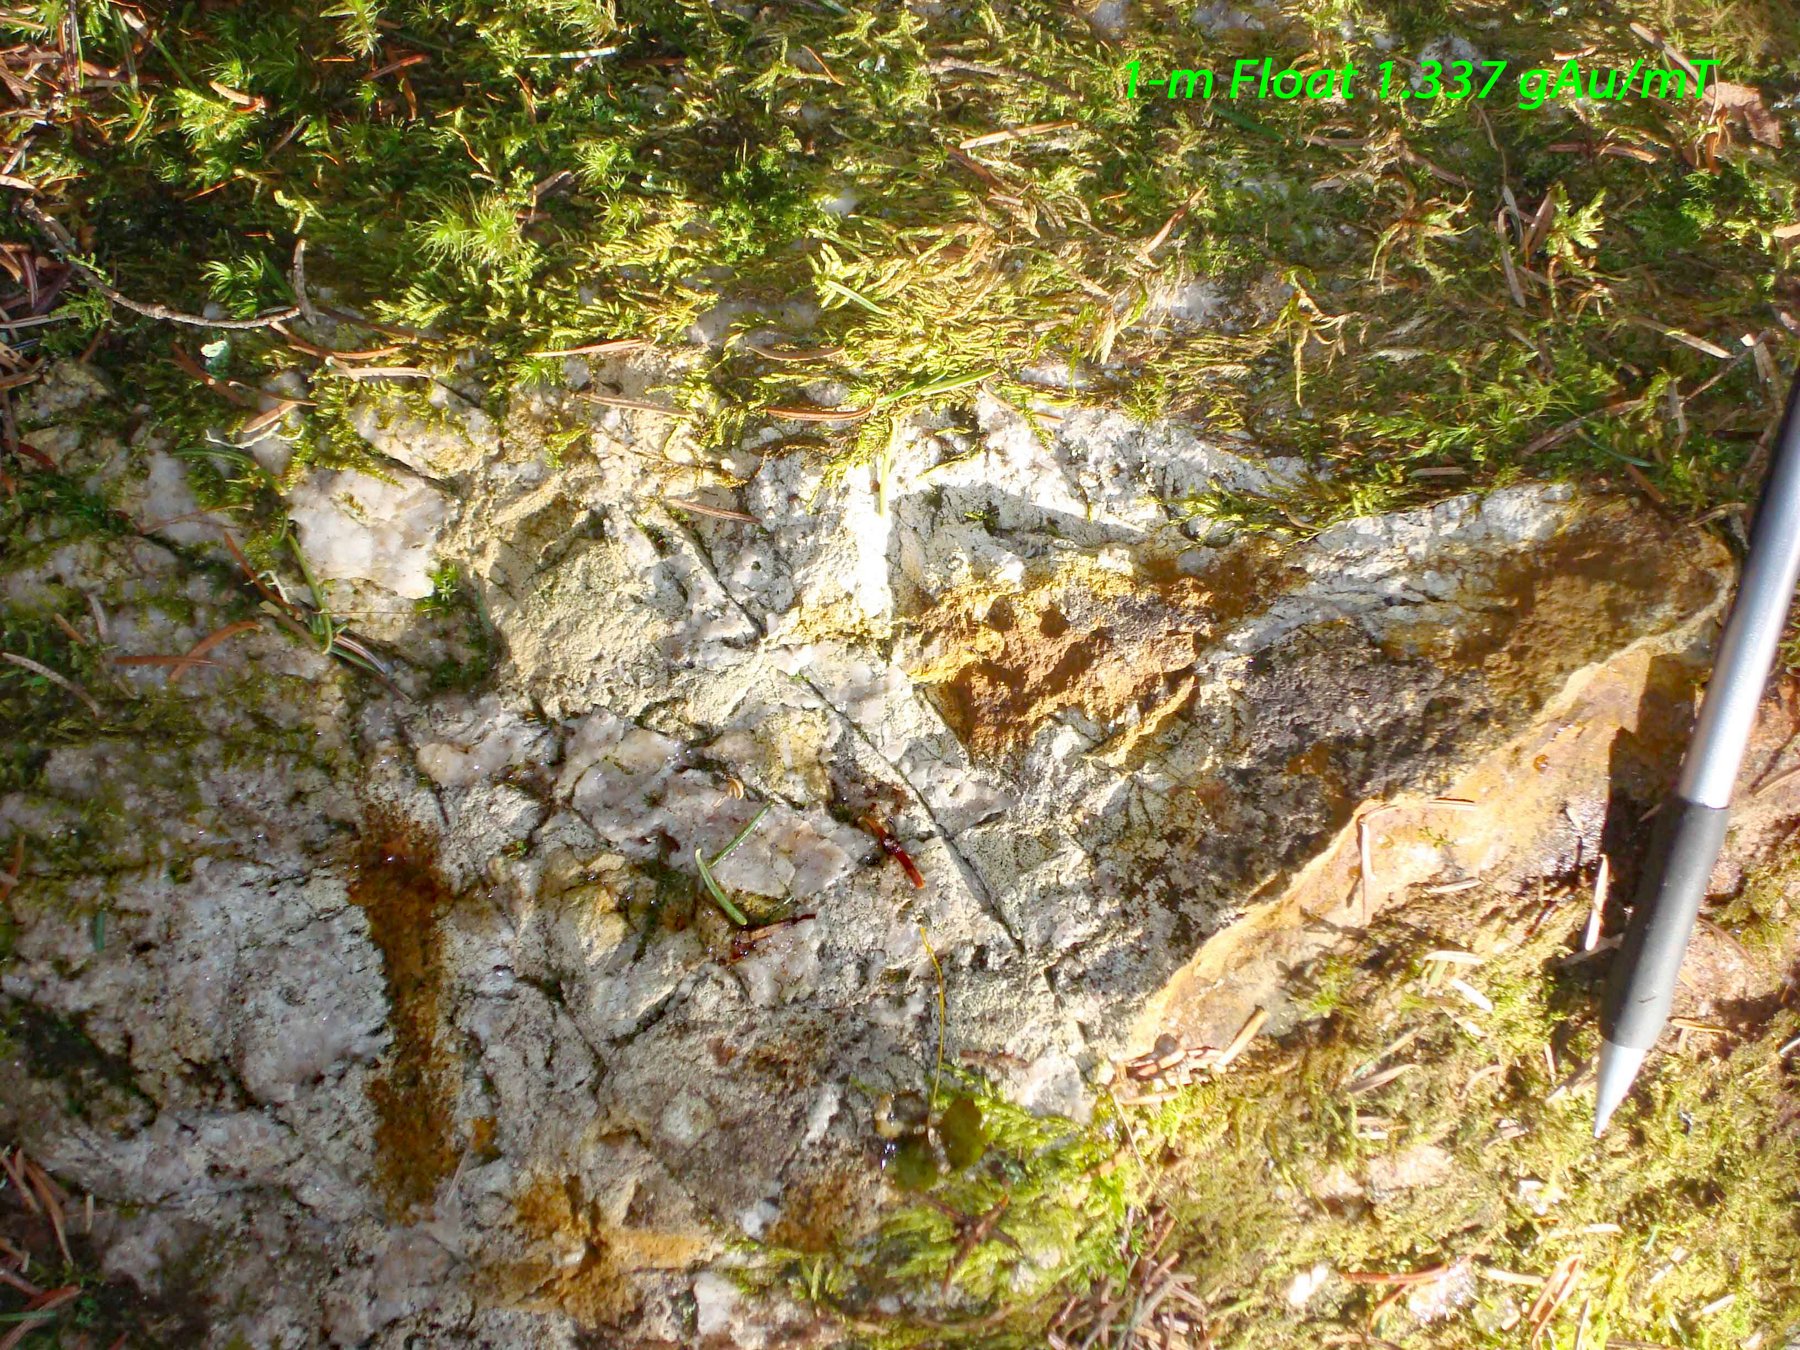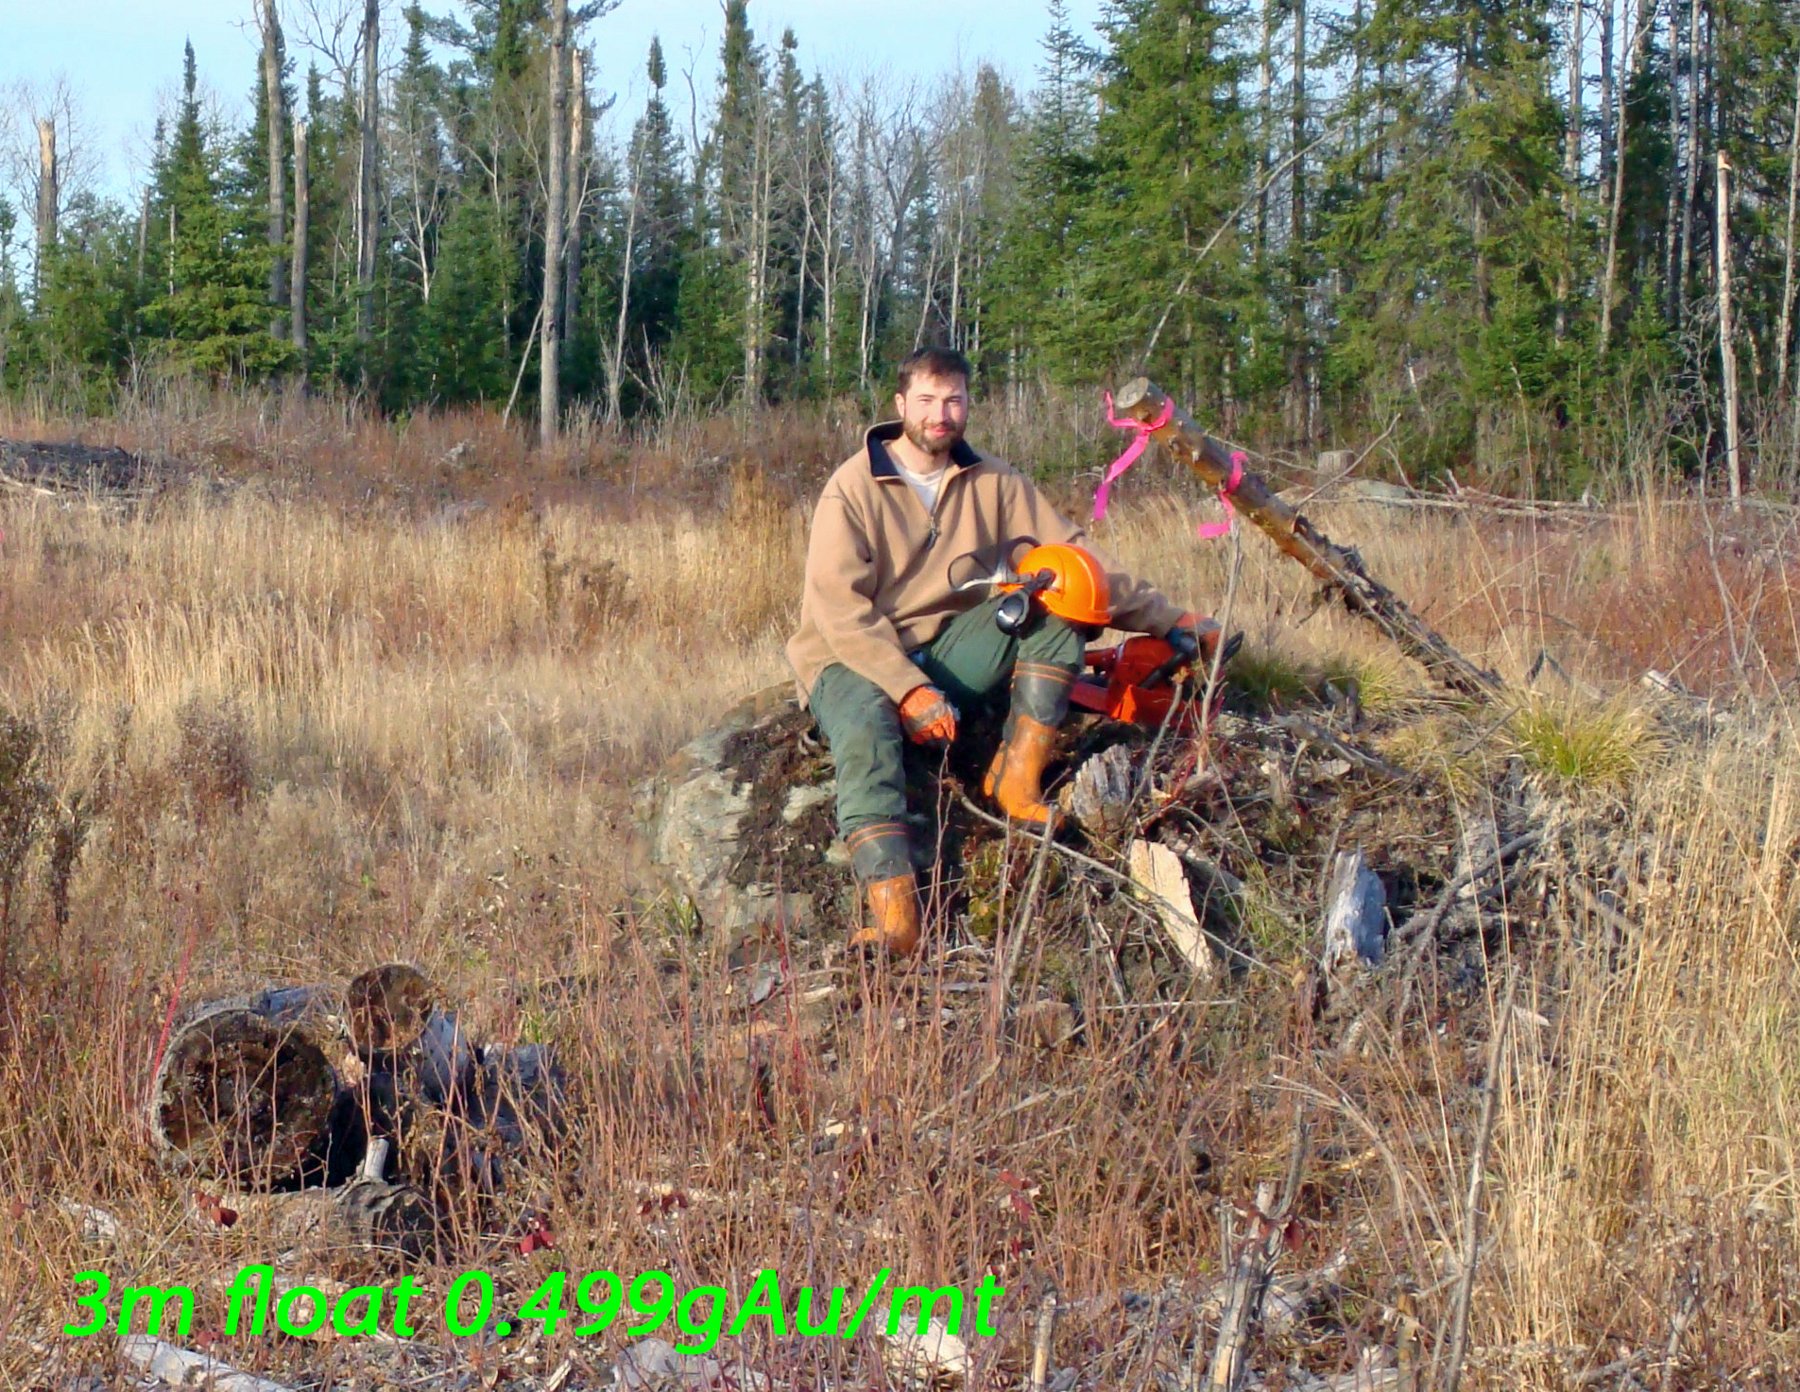
1 meter float L4550E-255S
1.337 g Au/mT
The highest of the three, where the main bundle of glacial vectors meets. Field sample 6895, at 564,152 E / 5,326,588 N.
Tracing gold-bearing boulders back to their source


Imagery © King’s Printer for Ontario (LIO); drone photos © Kirkland Gold.
Much of the Eby–Otto property is covered by glacial overburden, so the bedrock can't always be seen. What lies on the surface still tells a story. Float is loose rock that glaciers tore from the bedrock and carried away. When a vein or altered zone is eroded, its pieces are spread out down-ice in a fan-shaped trail called a float train.
On this property some of that float is large: quartz-veined and altered boulders several metres across. Big blocks don't travel far, so they point to a source close by. Mapping where the float lies, and walking back along the ice direction, is one of the cheapest ways to find the bedrock it came from.
The moving ice plucks blocks from a gold-bearing vein or altered zone in the bedrock.
As the ice melts, the pieces are left behind in a trail that thins out down-ice: large near the source, small far away.
On a map the float makes a fan. Walking back up-ice, toward the biggest blocks, leads to where the source should be.
The red lines on our float map are the glacial transport vectors worked out in a glacial study of the area. Every float found on the property is plotted against them, so each trail can be followed back up-ice to its likely source.
Doug Robinson's full float map, with every other boulder, its photos and assays, is being prepared for partners.
Request partner access Open the Property ViewerThe highest of the three, where the main bundle of glacial vectors meets. Field sample 6895, at 564,152 E / 5,326,588 N.
On the south edge of the property, where a second, smaller set of vectors meets. Field sample 6892, at 564,032 E / 5,326,422 N. Doug Robinson's 1994–96 field map reads 497 ppb (0.497 g/t): "3m Float, Intense FeCa, Bleached, Dis Py". Tilsley's 1996 report (AFRI 42A01SE2010) gives 0.495 and Doug Robinson's label on the 2008 photo 0.499; the map value is used.
The largest block of the three. Field sample 6894, at 564,151 E / 5,326,532 N.
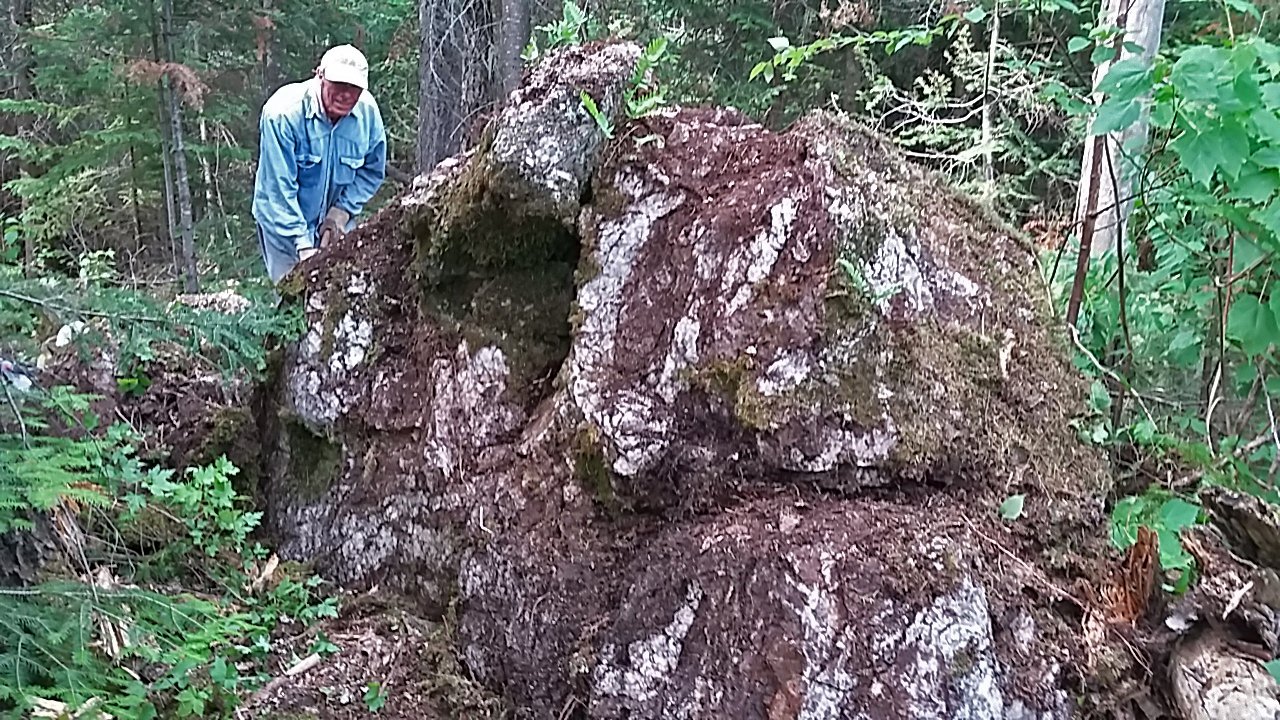 4 meter float – L4560E-312S, 2009-05-11: 10% quartz veins, 90% intense alteration
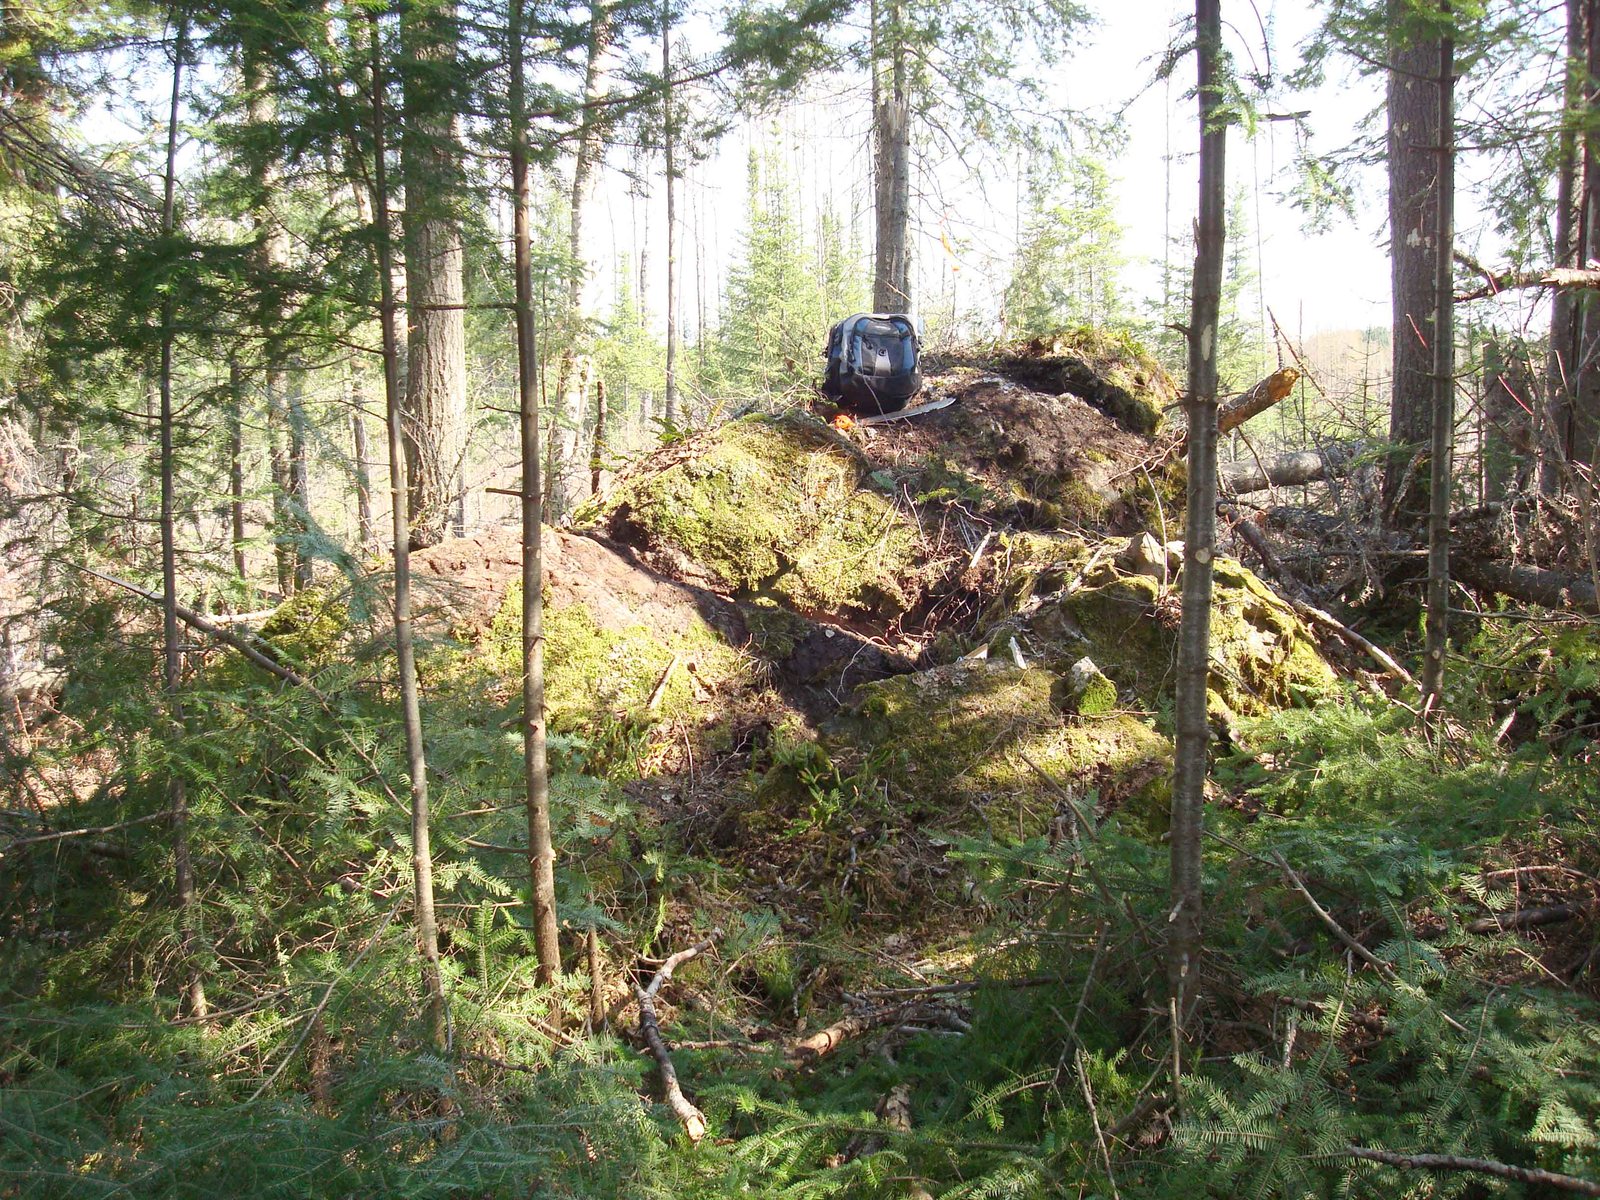 4 meter float – L4560E-312S, 2009-05-11: the whole block in the bush, a backpack on top for scale
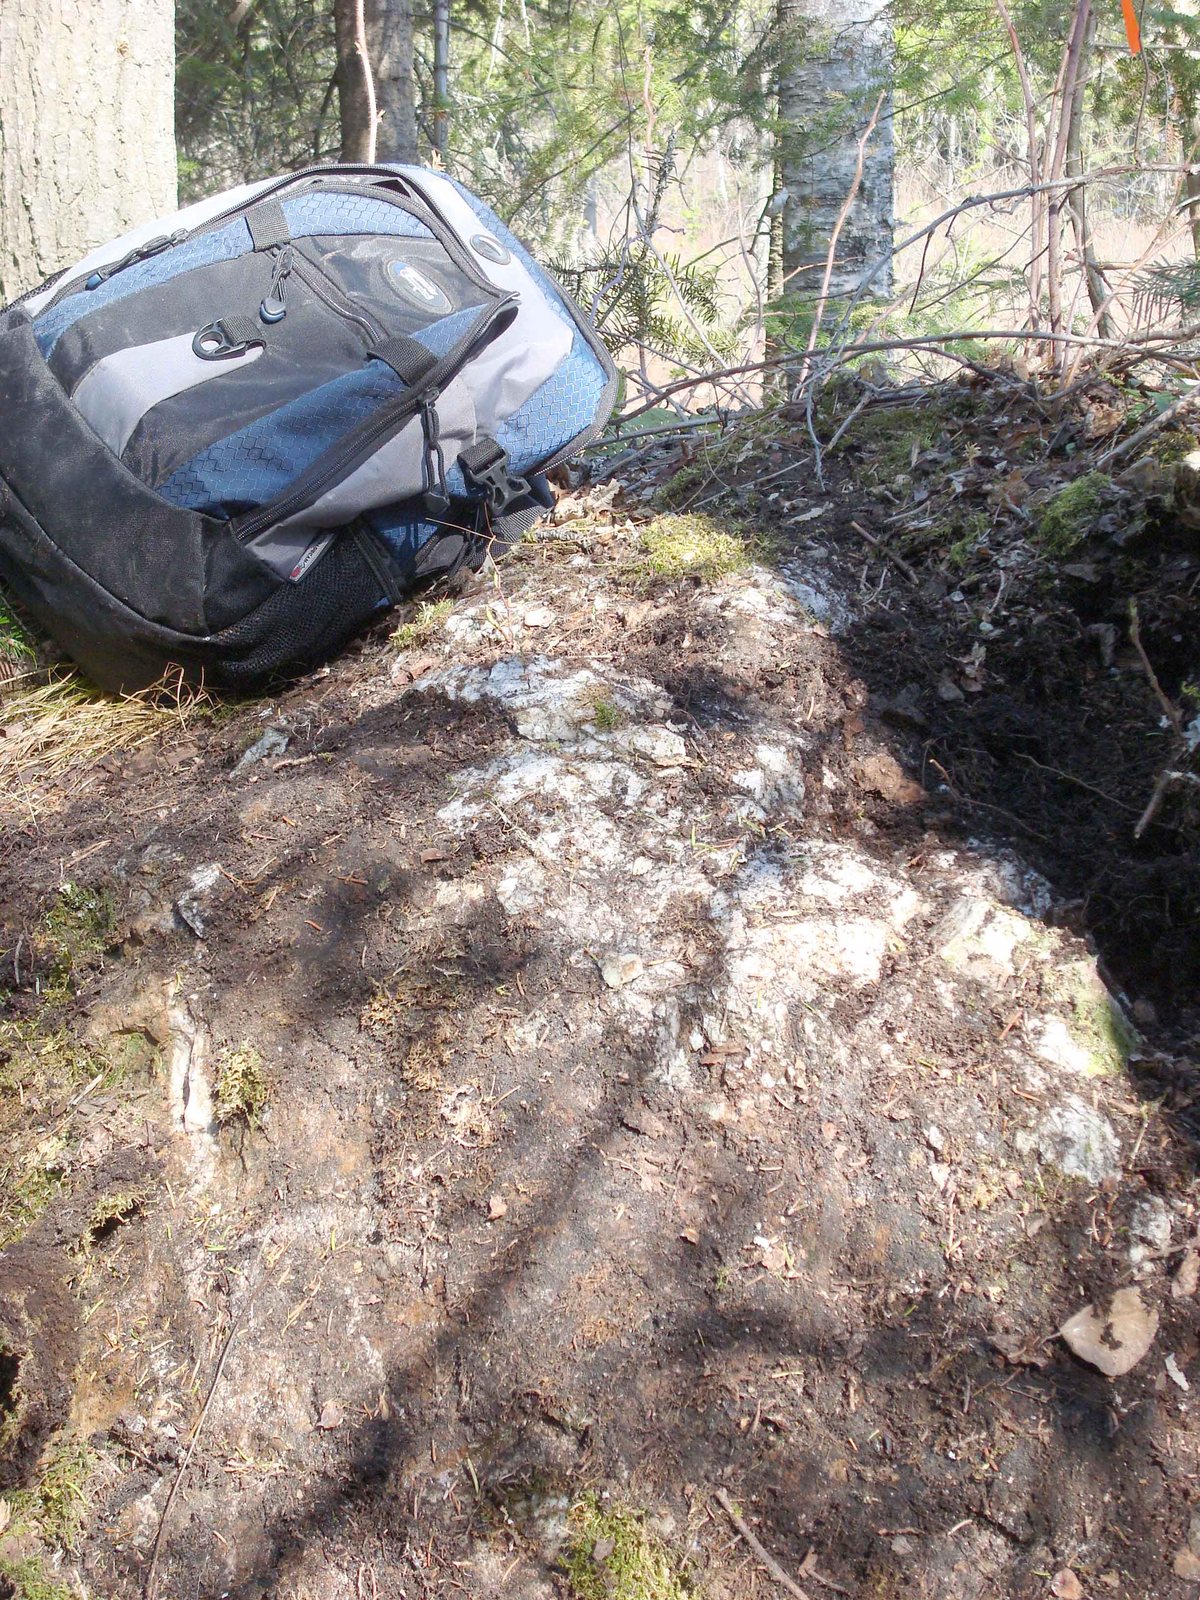 4 meter float – L4560E-312S, 2009-05-11: the top of the block, with a backpack for scale
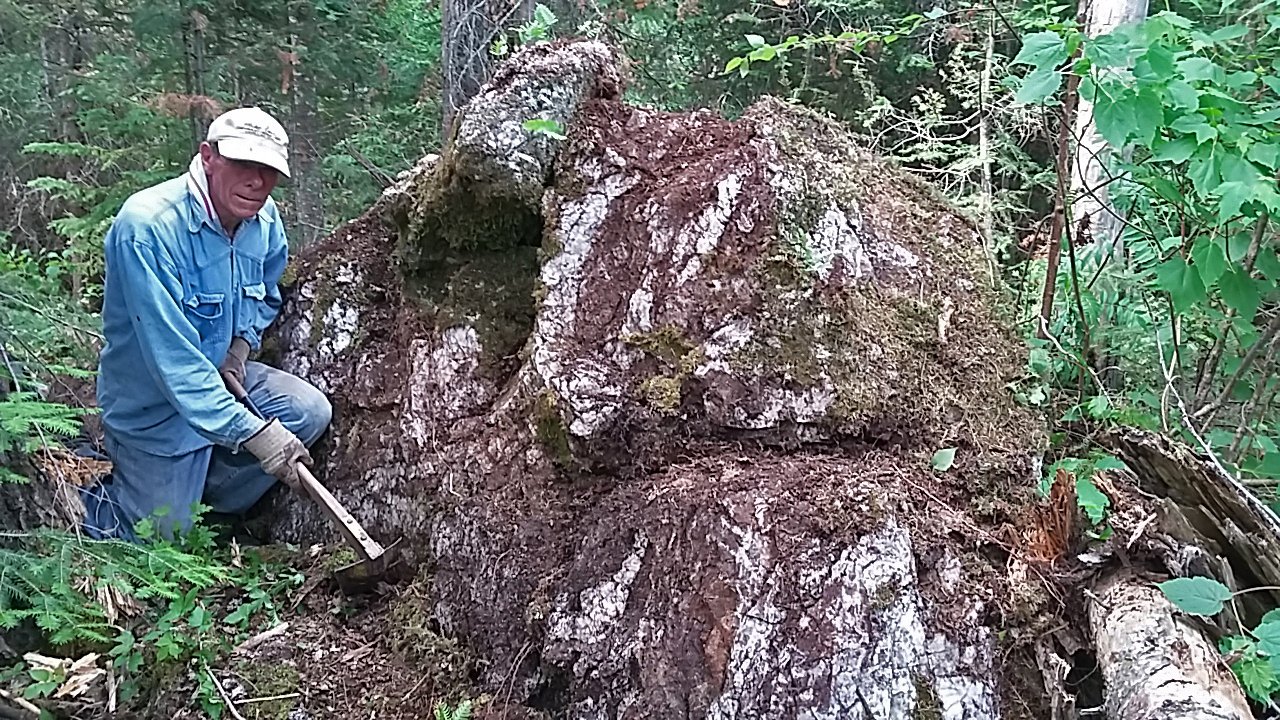 4 meter float – L4560E-312S, 2017-07-06, with Doug Robinson for scale
Gold values as written on Doug Robinson's 1994–96 field map (1:1000) – not yet matched to a lab certificate. Ice direction for all three floats: the Tilsley 1997 glacial report (AFRI 42A01SE2010).
A float tells us roughly where the gold came from. The structure tells us where it goes underground. Four steps take us from a boulder in the bush to a drill target.
Each float is walked back against the ice direction. Where the trails meet, near a showing, is where the gold-bearing rock should reach surface.
The faults and shears on the property go down steeply to the south. The deeper you go, the further south the structure is.
The gold is not spread through the whole plane. In the Kirkland Lake camp it forms shoots that plunge down and to the south-west along it.
A hole started south of the showing and drilled back north cuts the plane at depth. Following the rake moves that target south-west.
The south dip comes from the structures found on the property; the south-west rake is how gold zones behave across the Kirkland Lake camp. Drilling is what tests it.
Explore the showings, structures and sampling in 2D and 3D.
Open the Property Viewer All showingsKirkland Gold is an independent prospector partnership. The Eby–Otto property is open to an investor.
Apply to be an investor Talk to us Request a site visit