


G vein
0.74 g Au/mT best gold – over 0.78 m, channel 7720, 2021- ~1 m quartz vein, alteration and silicification
- Four strands, G1 to G4
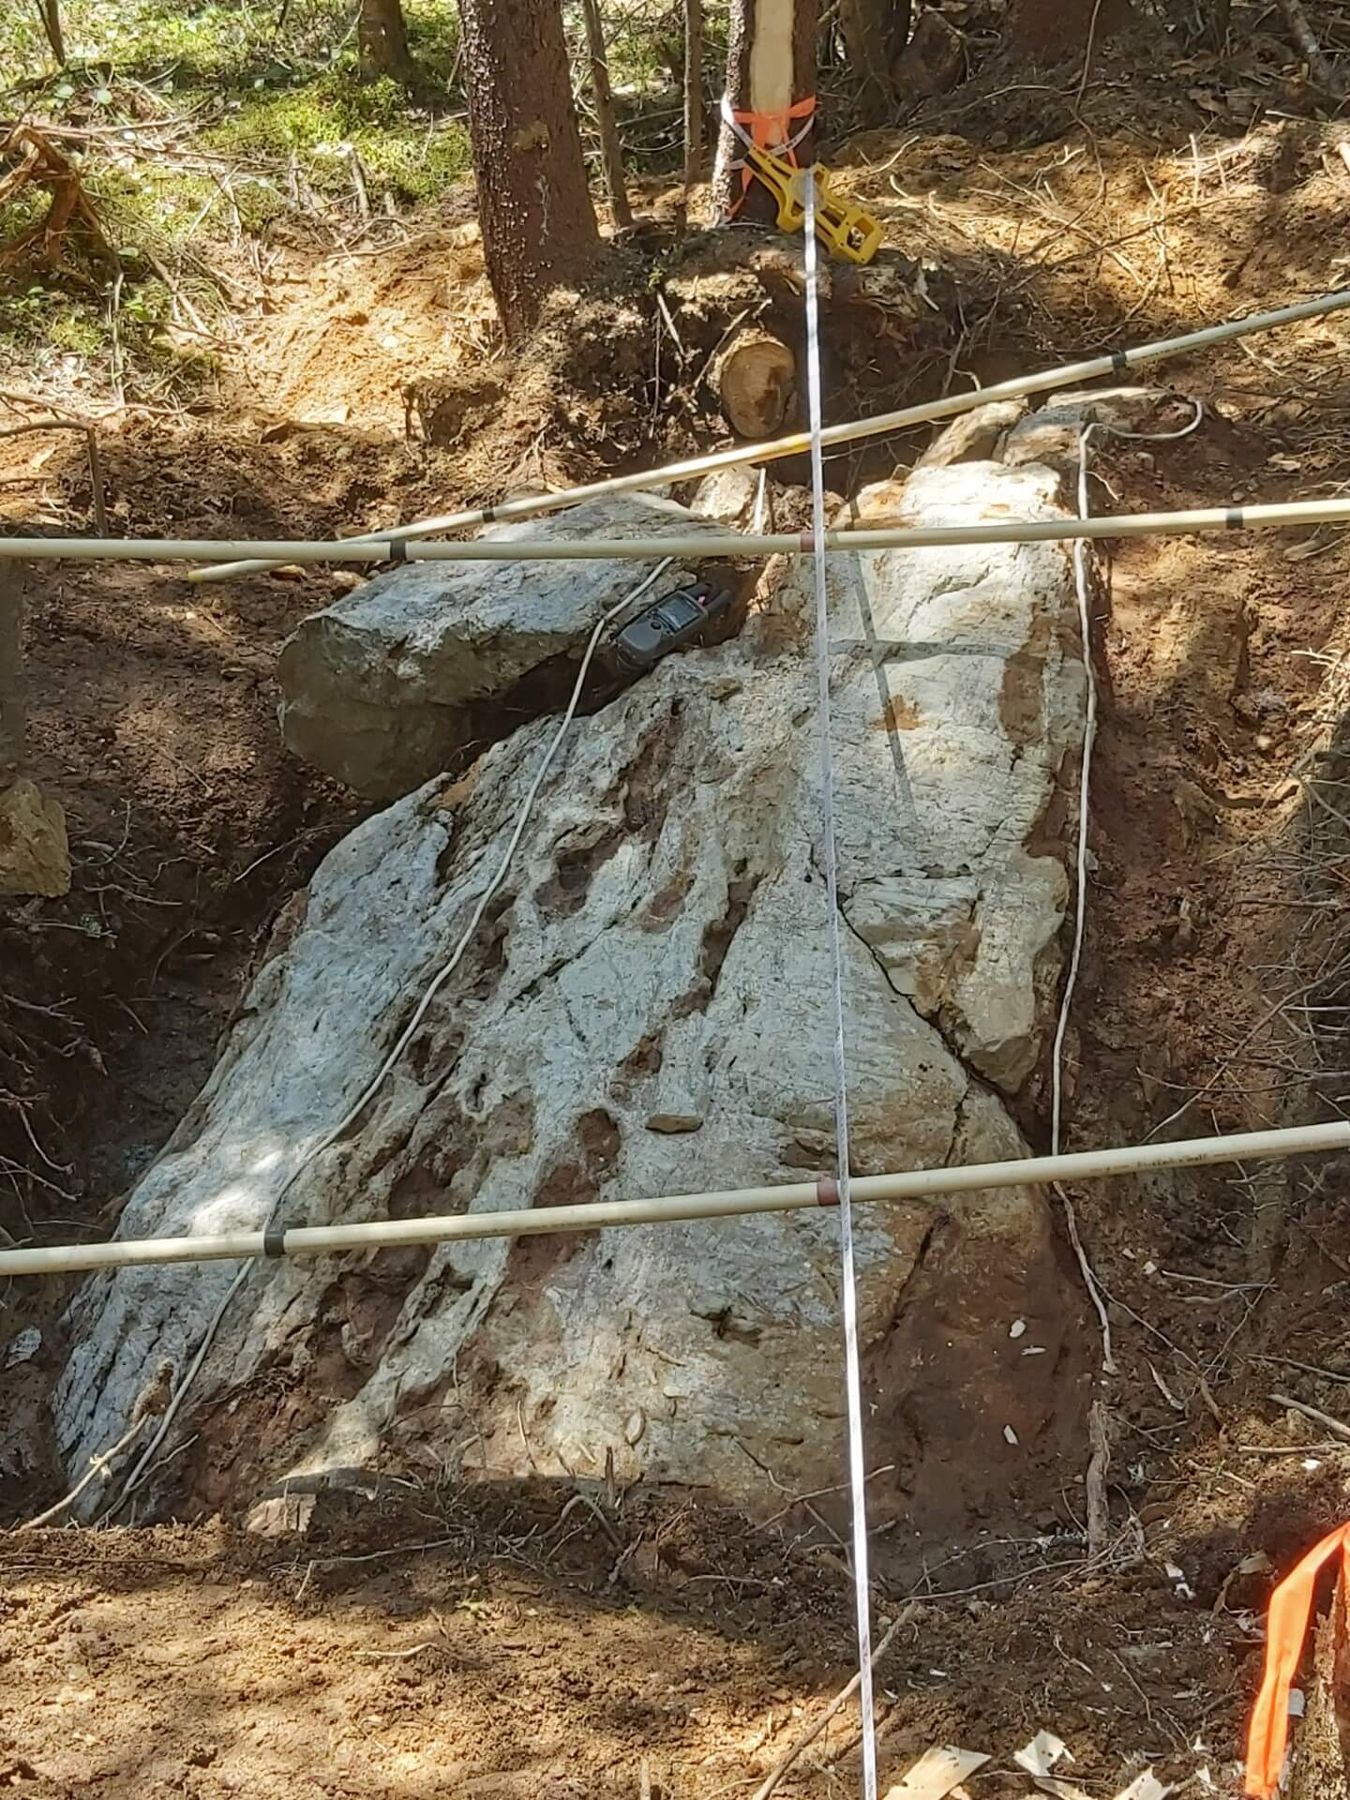
- Discovered by stripping in 2021
- Not drill-tested
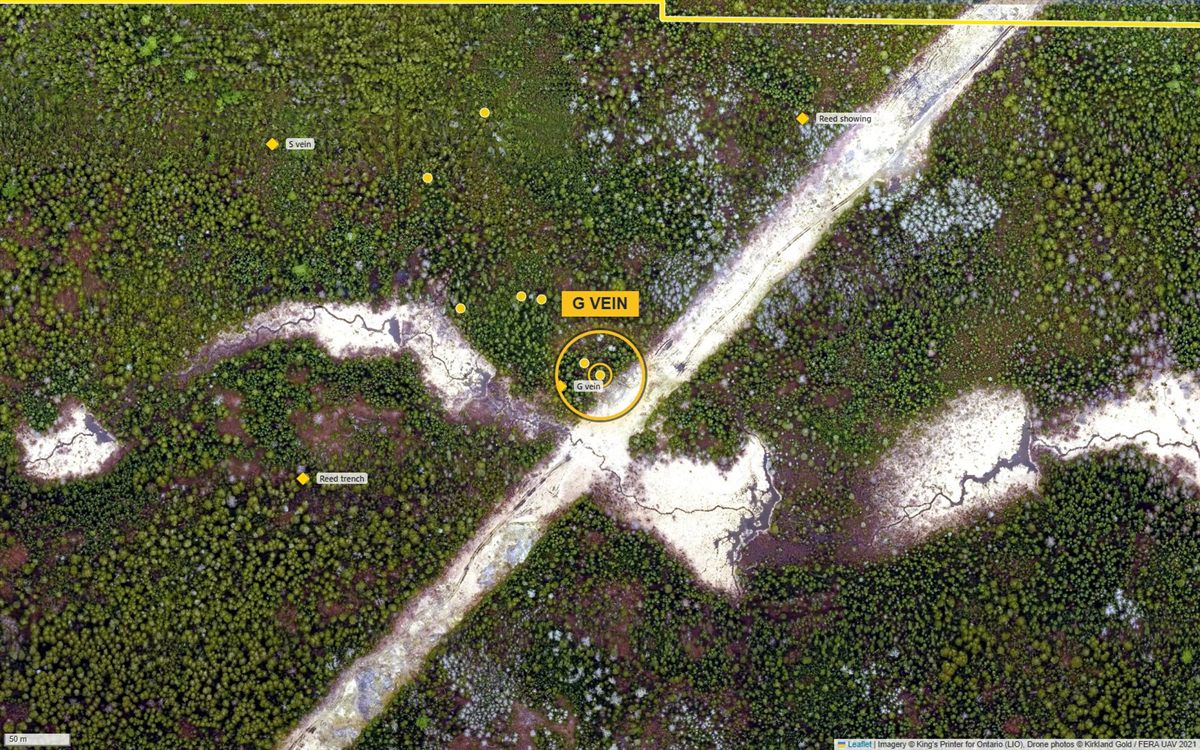
Imagery © King’s Printer for Ontario (LIO); drone photos © Kirkland Gold.
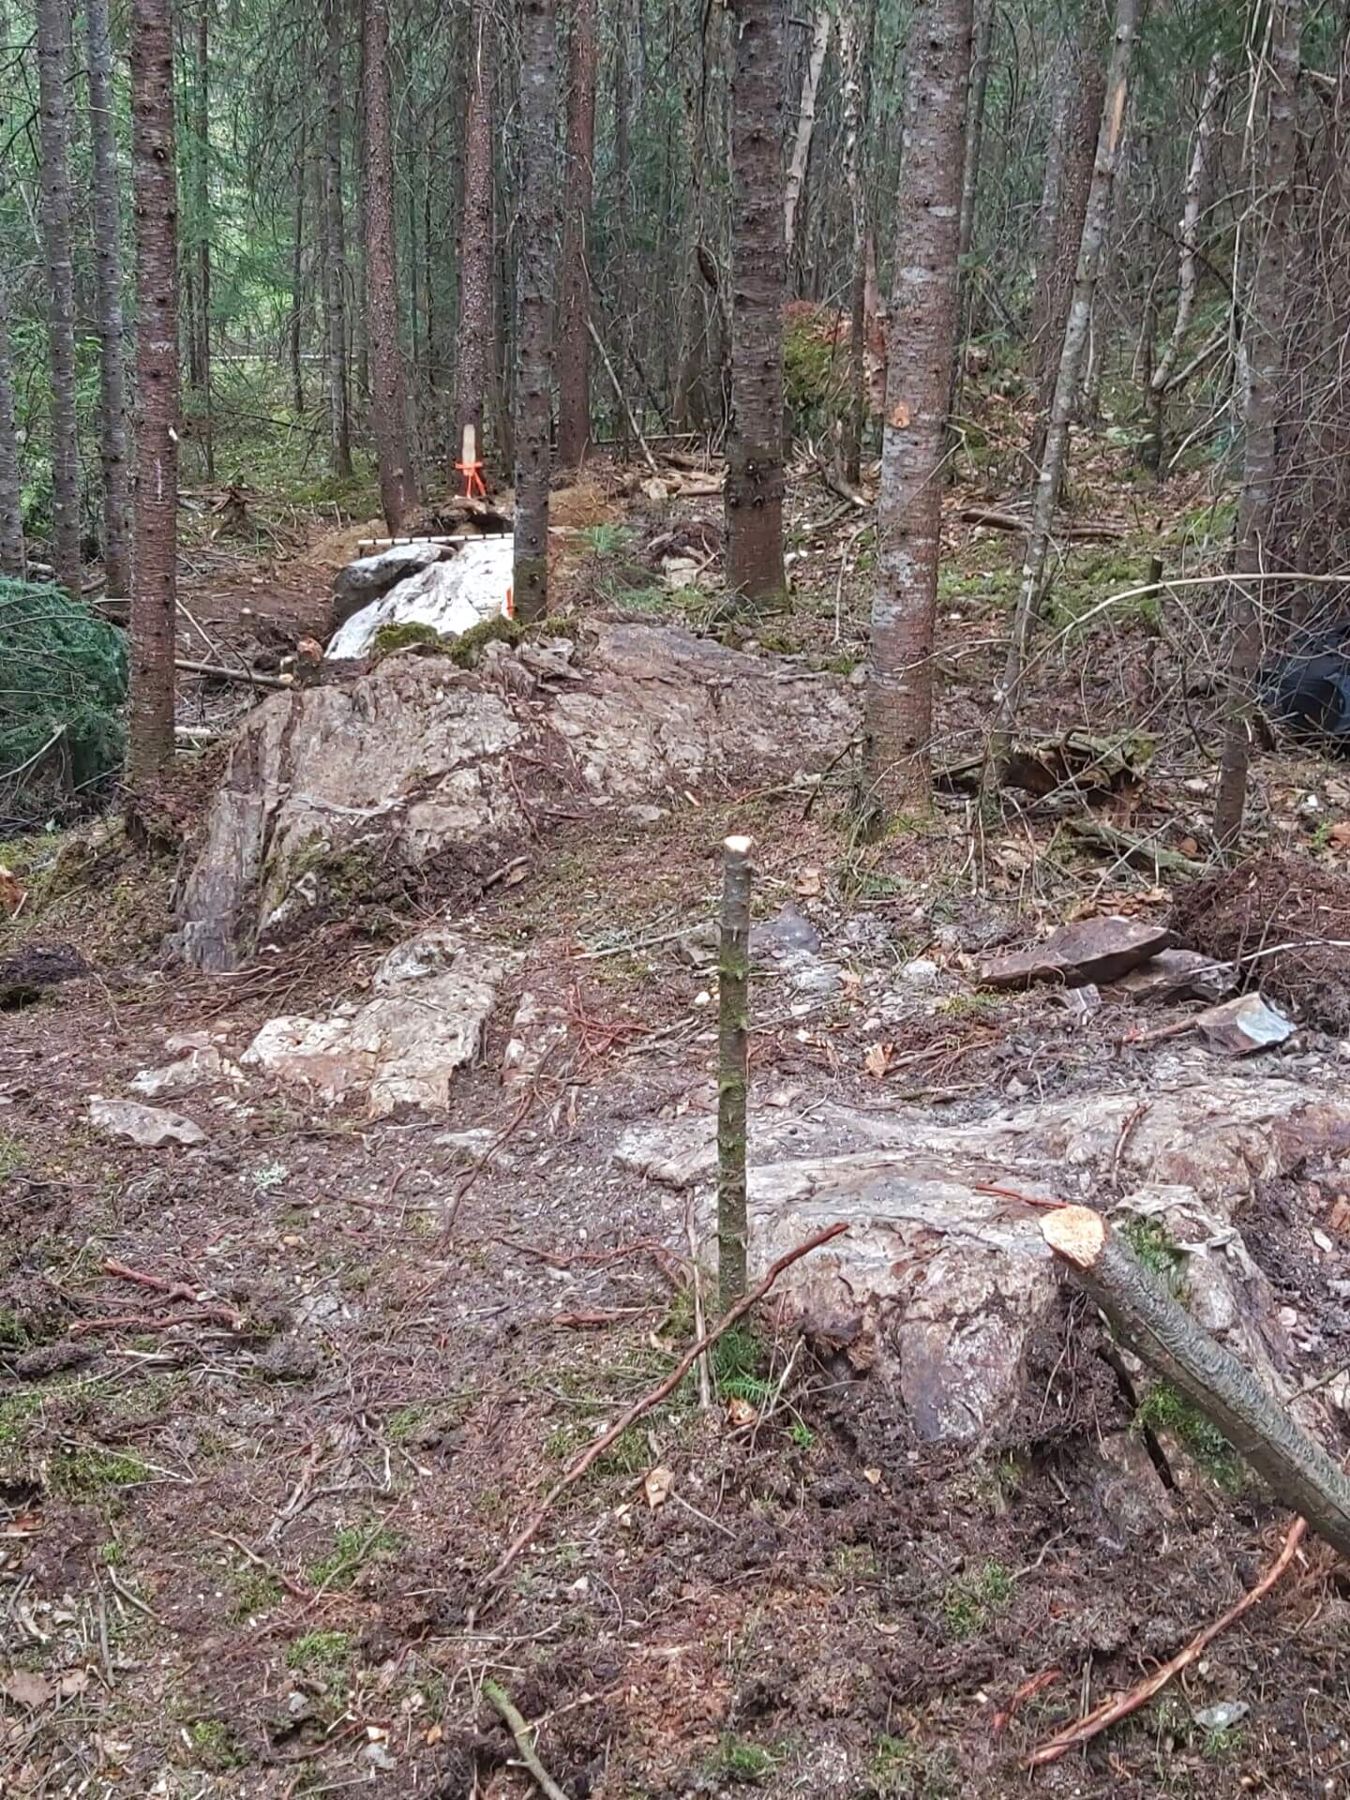
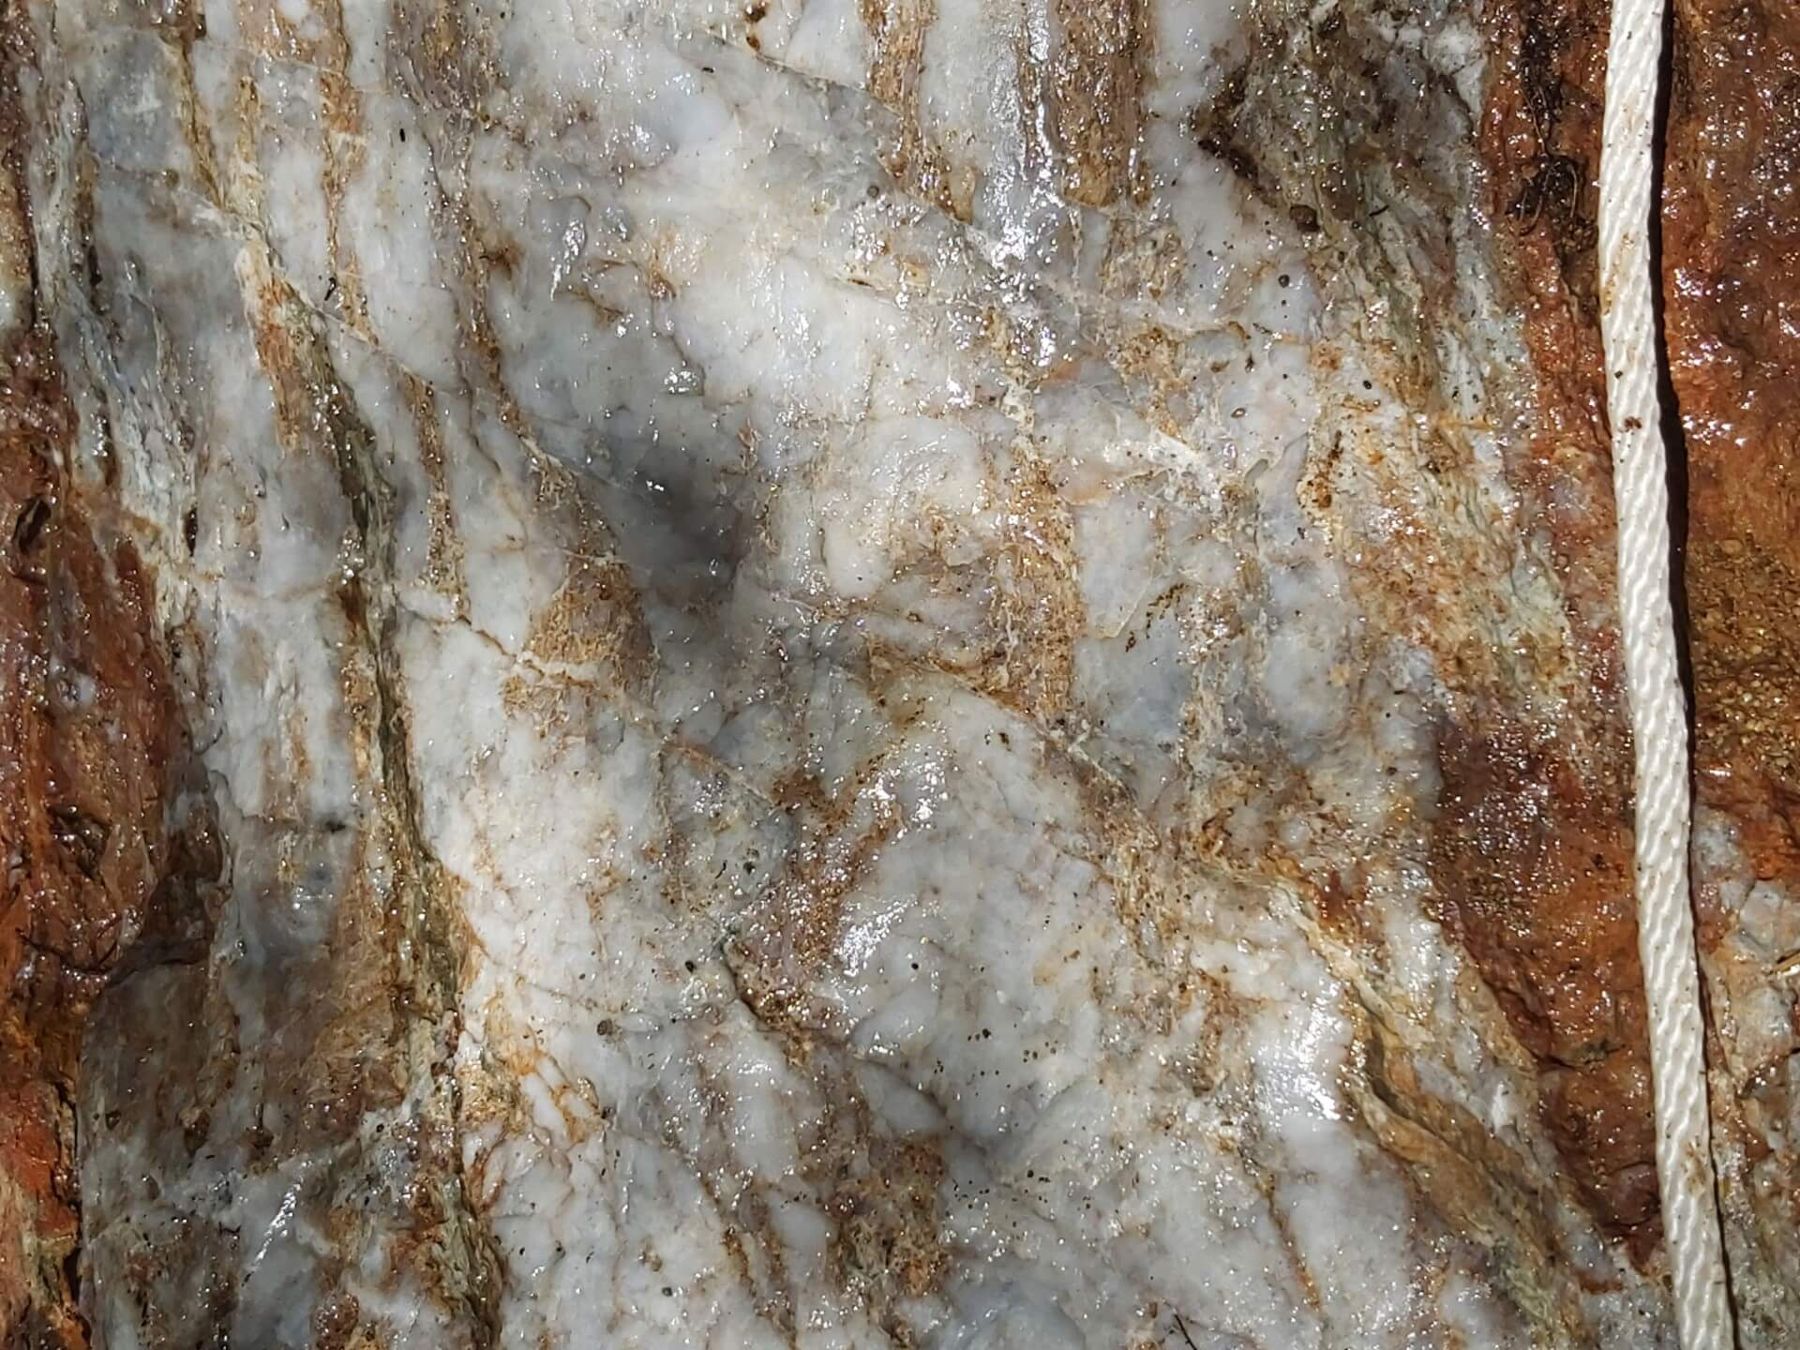
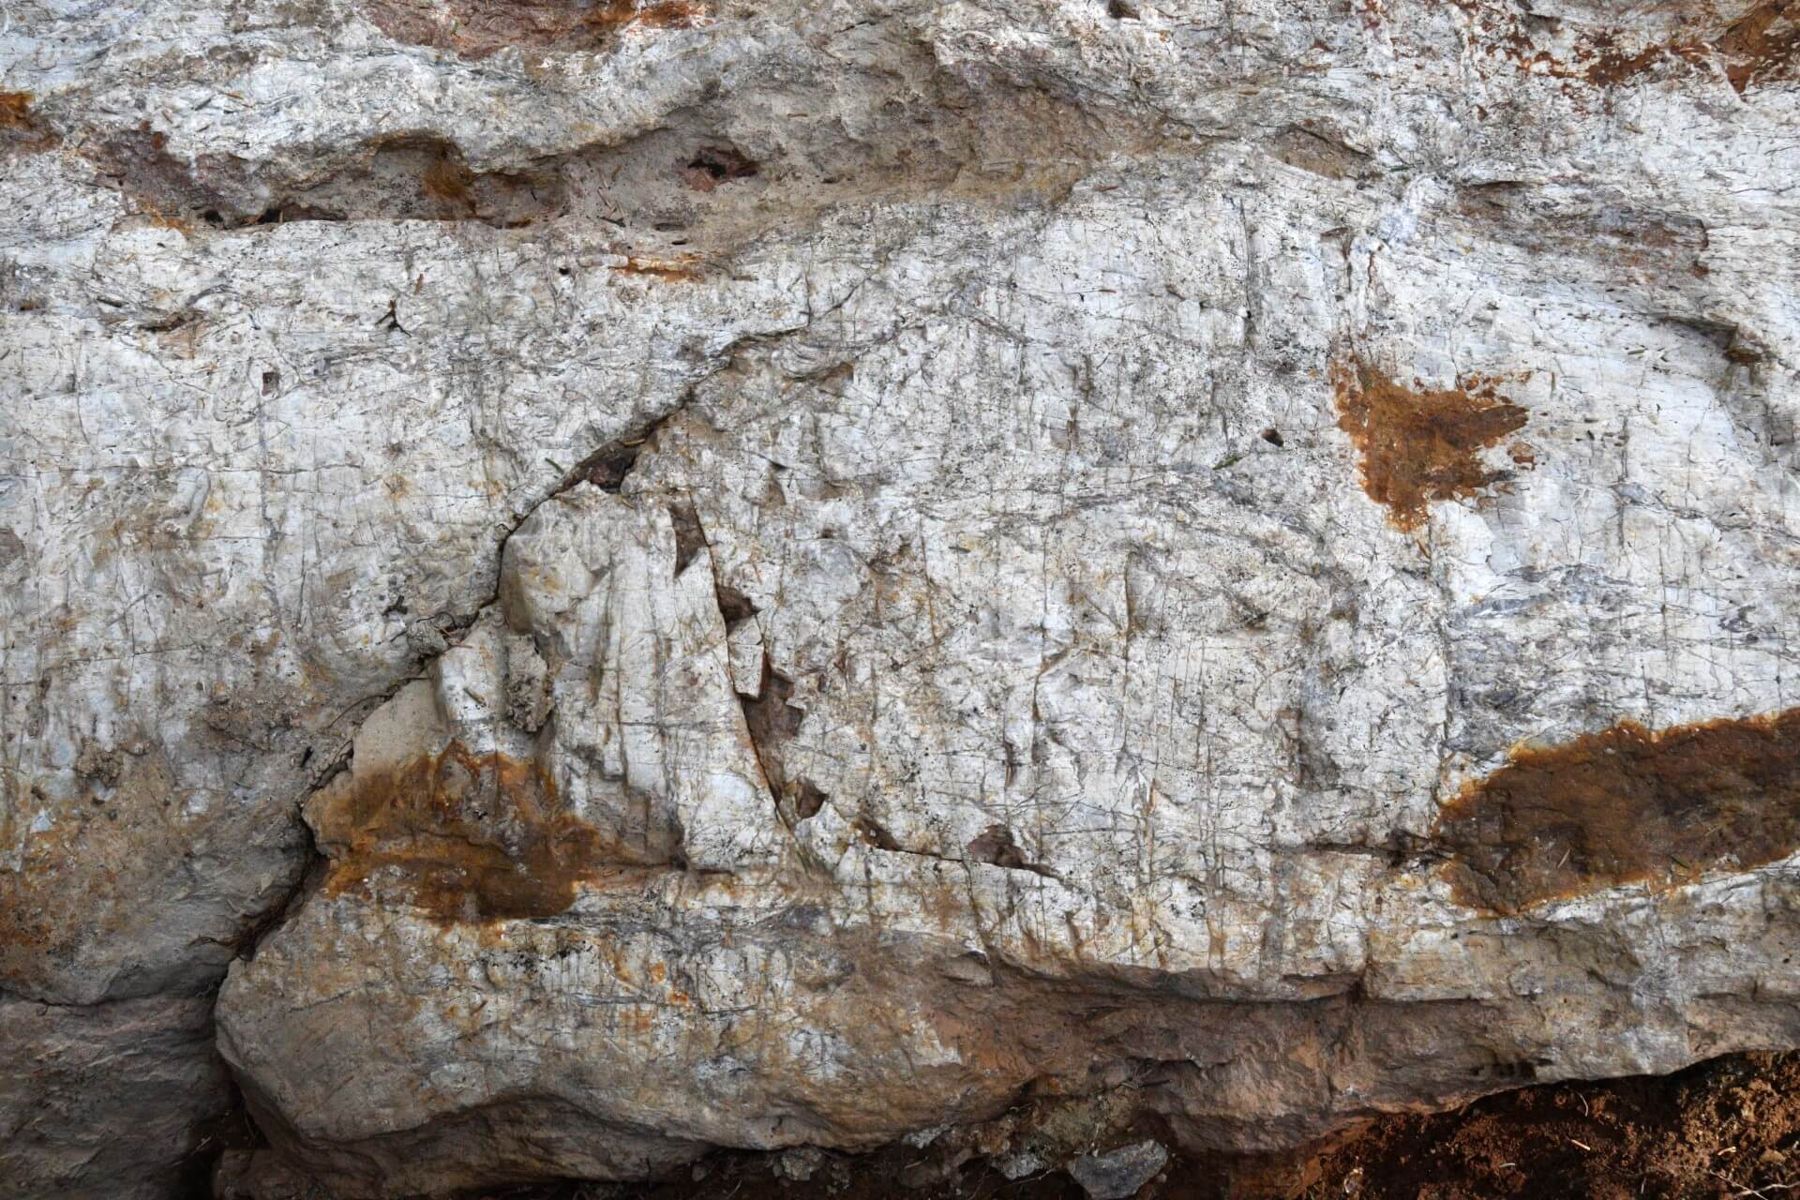
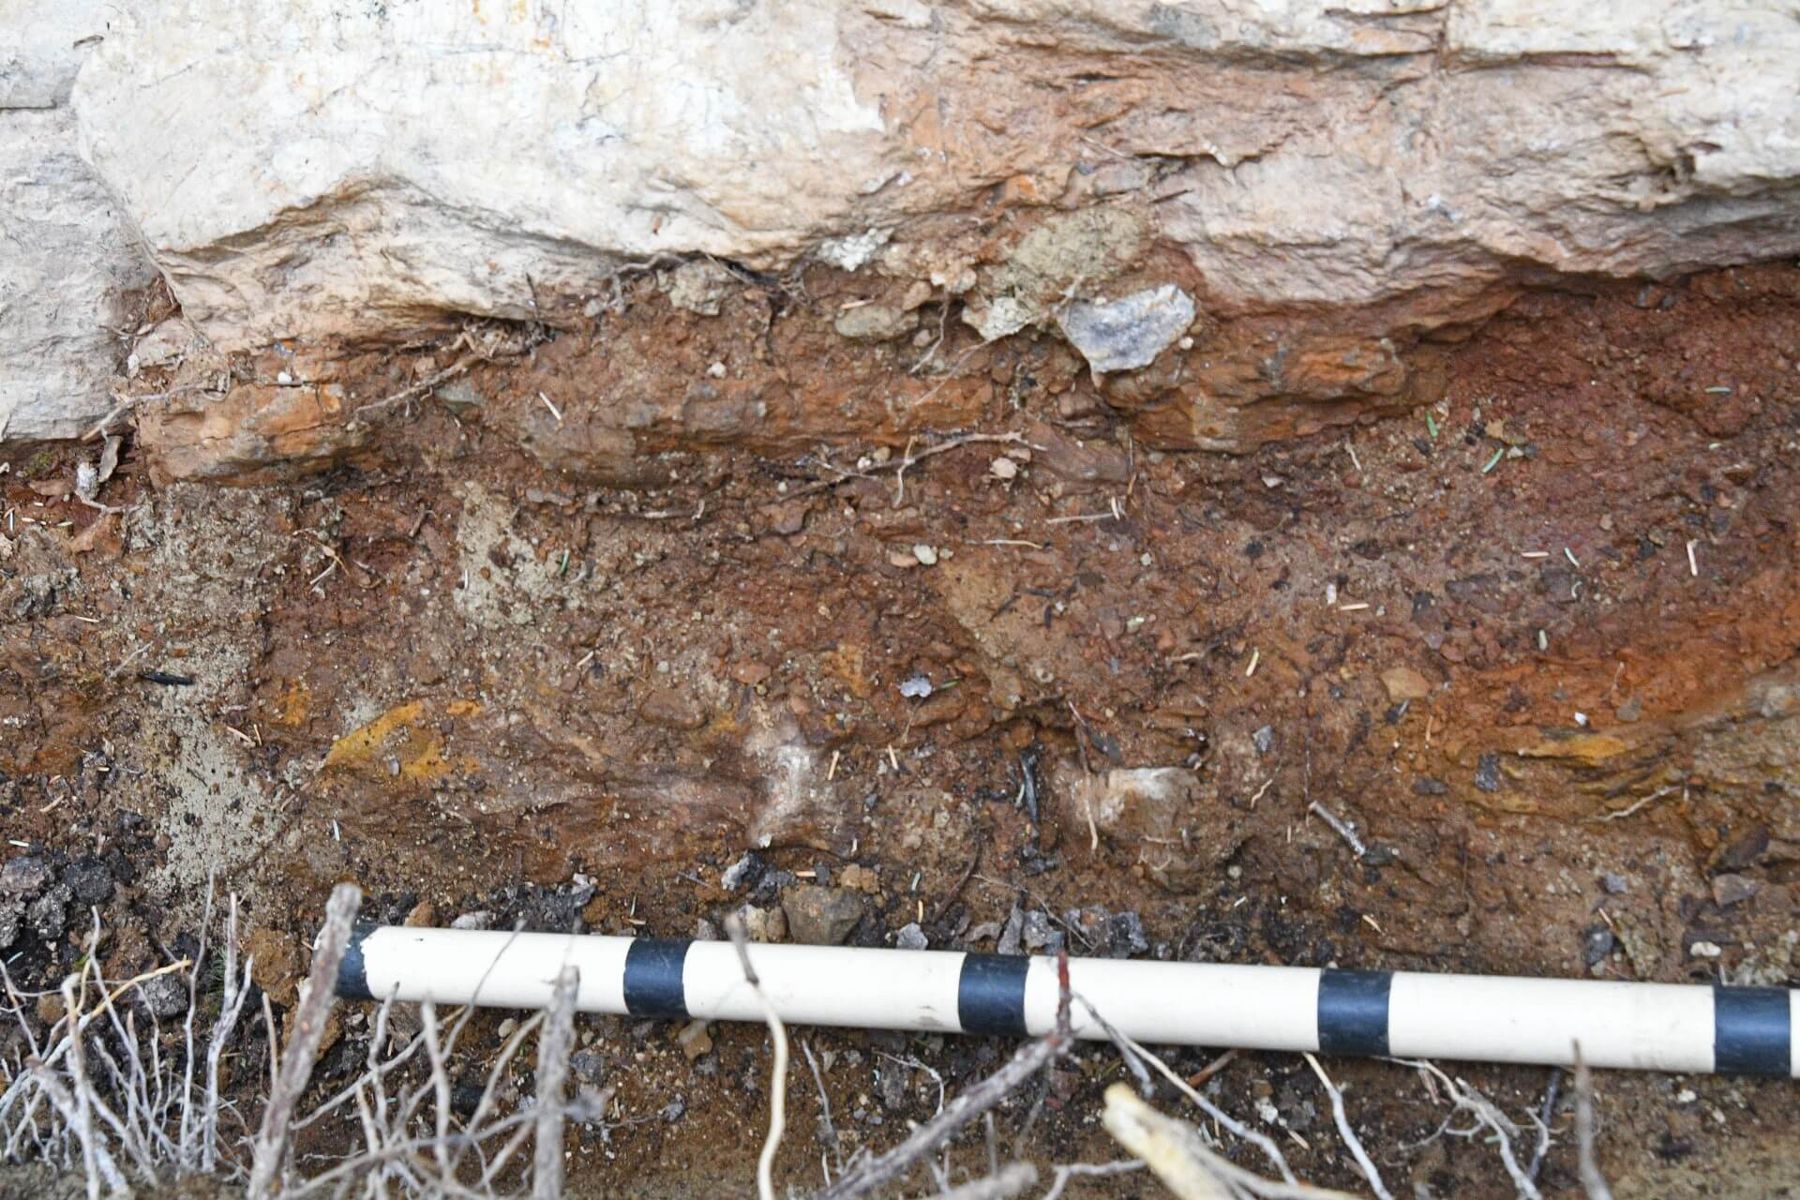
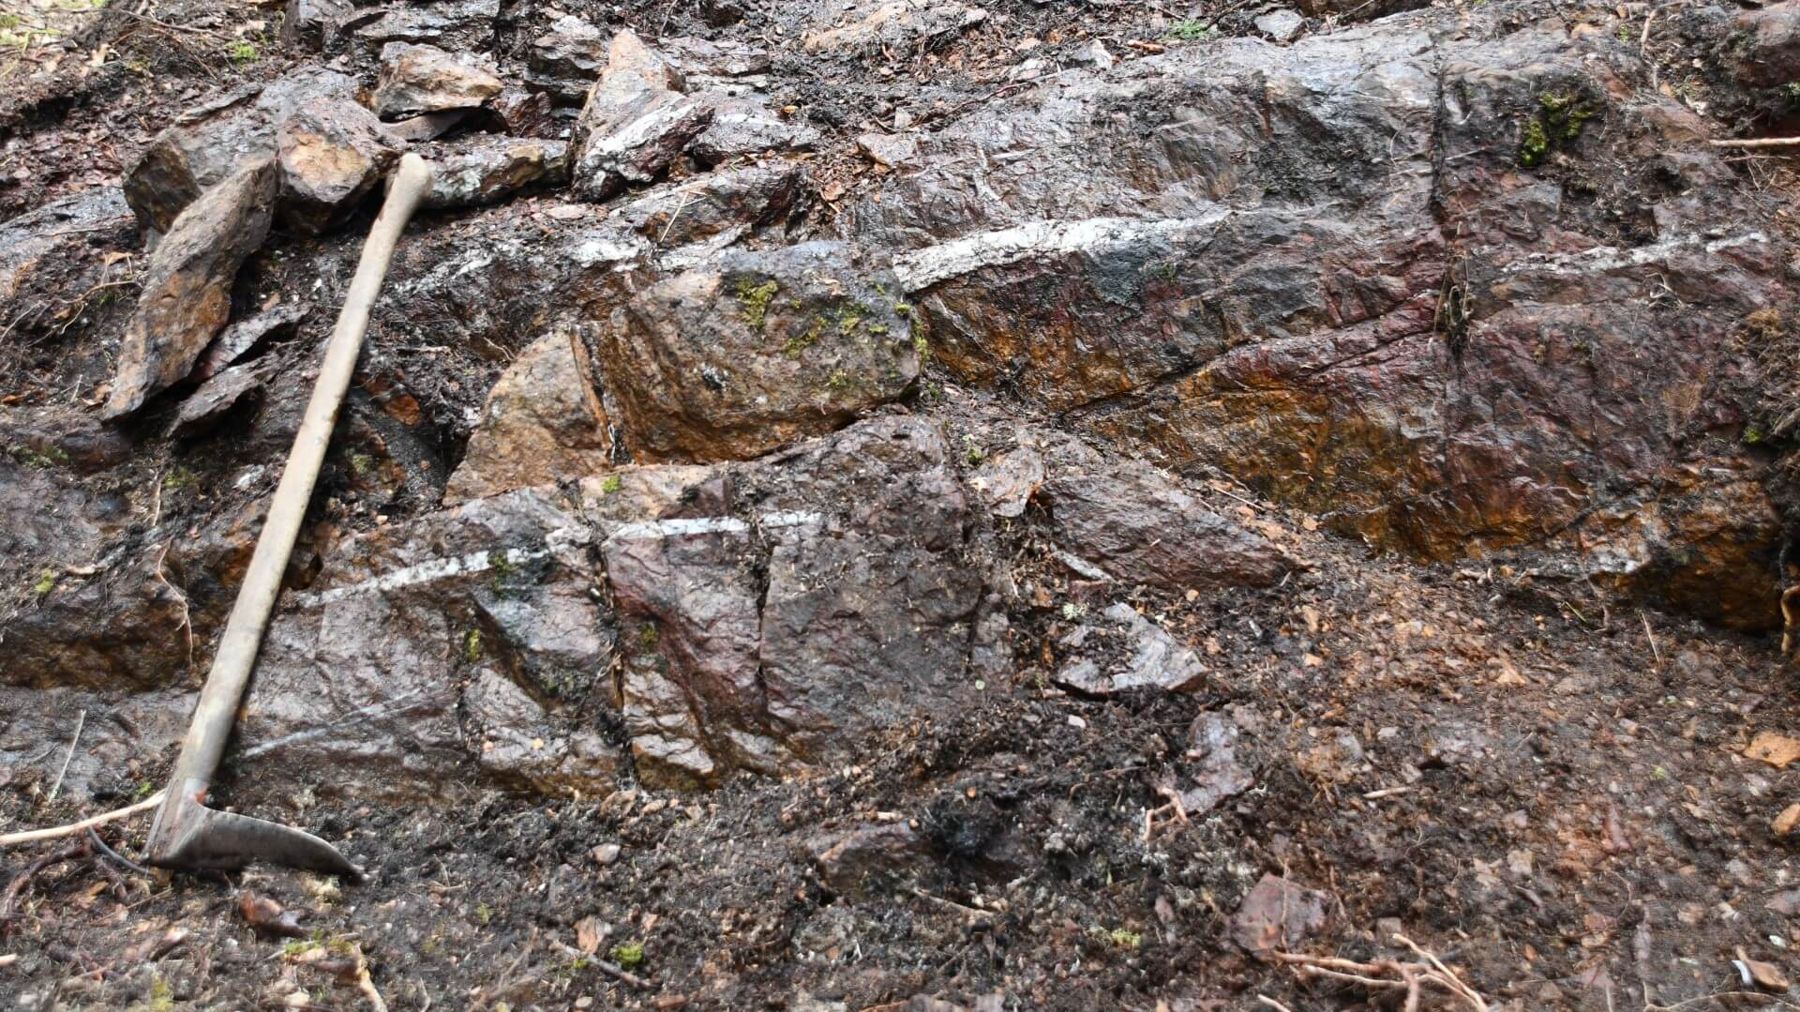
Stripping in 2021 revealed an outcrop more than a metre wide with three distinct parts: a white quartz vein about a third of the width, a mixed alteration zone with variable weathering, and massive silicification.
Location
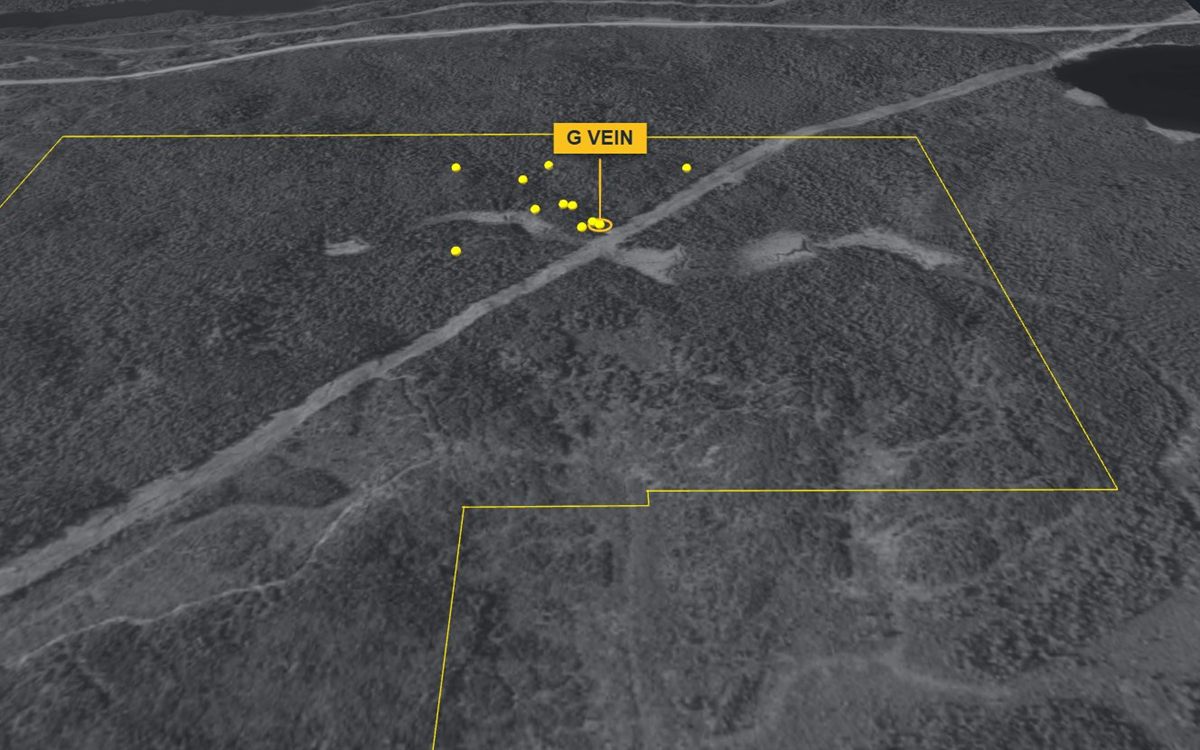
The G vein is about 250 m south-south-west of the Reed showing, in the Kirkland Lake gold camp of north-eastern Ontario. It has four strands, G1 to G4.
| UTM (NAD83, zone 17N) | 563710 E, 5327026 N |
|---|---|
| Latitude / longitude | 48.0933° N, 80.1444° W |
| Elevation | 311 m above sea level |
| Townships | Eby / Otto, Larder Lake Mining Division |
| Surveyed | GNSS survey by Surveyors on Site, May 2022 (zero reference point, about ±0.5 m) |
Geology
The G vein is hosted in broad Fe-carbonate alteration – the host of much of the Kerr-Addison ore at Larder Lake and of other local gold mines. Its quartz is typical of the gold veins in the Larder Lake–Kirkland Lake break system, and the alteration varies along it, as expected in gold ores.
Sampling
Every sample recorded within about 45 m of the showing, from the site’s database:
| Year | Sample | Type | Width | Gold | Description | Report |
|---|---|---|---|---|---|---|
| Loading the samples… | ||||||
Grab samples are selected pieces of rock and are not representative; channel samples are cut across the vein or zone. The Reed showing’s cut samples and laboratory certificates are on the Reed showing page.
Photos
Click a photo to enlarge it. More photos are on the map’s Photos layer.
Geophysics
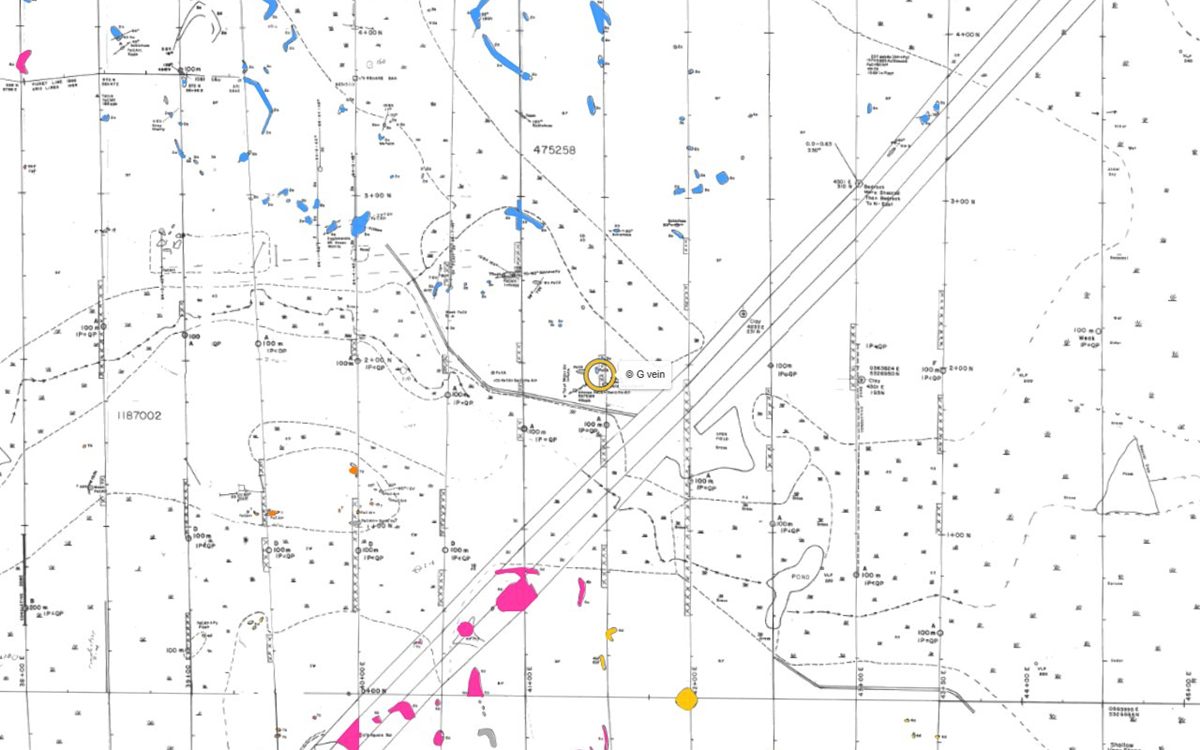
The G vein lies inside the 1994–96 Reed grid, covered by ground magnetics and EM (MaxMin), and inside the 2021 Aerial drone magnetic survey; the 2022 3D IP survey was run over the claims.

Survey views
The drone magnetics, the 3D magnetic model and the IP survey are in the Property Viewer for investors.
Drilling
The G vein has not been drill-tested. The nearest drilled holes are short (about 35 m) holes from 1984, about 370 m to the south-west.
| Hole | Year | Company | Length | Distance | Report |
|---|---|---|---|---|---|
| Loading the holes… | |||||
The nearest recorded drilled holes; distances are from the showing to the hole’s collar. All holes: the drilling page.
History
- 1994–95 – The J. Reed group: stripping, EM and magnetic surveys, mapping and assays over the area, including rock samples near the vein. AFRI 42A01SE0088
- 1994–96 – Doug Robinson, P.Eng.: ground magnetics and EM (MaxMin) over the Reed grid. AFRI 42A01SE0028 (1995 EM)
- 2021 – The G vein discovered by stripping, then channel-sampled; the Aerial drone magnetic survey was flown the same year. AFRI 20000021754, 20000020517
- 2022 – The vein’s reference points surveyed by GNSS (Surveyors on Site), and a 3D IP survey over the claims. AFRI 20000020817
Reports
Assessment reports filed with the Ontario ministry that cover the showing:
- Assessment report, Eby–Otto NE group (J. Reed) AFRI 42A01SE0088 · 1994–95 · Stripping, EM and magnetic surveys, mapping, assays
- Geophysics of the J. Reed group (Doug Robinson) AFRI 42A01SE0028 · 1995 · EM (MaxMin) survey
- Deposit-alteration modelling, 2021 fieldwork, Reed Robinson property (Doug Robinson) AFRI 20000021754 · 2021–23 · Stripping, mapping, channel sampling, magnetic susceptibility
- Aerial drone magnetic survey and 3D inversion, Eby Otto project (EarthEx) AFRI 20000020517 · 2022 · Drone magnetics
- 3D DCIP survey at the Reed-Robinson claims (Dias Geophysical) AFRI 20000020817 · 2022 · Induced polarization
Documents
Signed-in investors also get the library copies of these reports, the survey maps and the data room.
Take the guided tour
The Property Viewer flies to the showing, sets the layers and explains what you are looking at.
Other showings: Reed Showing · Reed Trench · S Vein · R Vein · Boudreau Showing · all showings