


Reed showing
19.75 g Au/mT best gold – grab sample 5967, 1994- 14.04 g Au/mT over 0.40 m, one of three cut samples
- Albite–pyrite zone, >5% pyrite
- Was never drill-tested
Imagery © King’s Printer for Ontario (LIO); drone photos © Kirkland Gold.
The gold at the Reed showing is high-grade – up to 18.8 g Au/mT in a single 0.20 m cut – hosted in a distinctive albite replacement zone with more than 5% pyrite. The showing sits on the edge of a sharp east-trending magnetic break, and it was never drill-tested.
Location
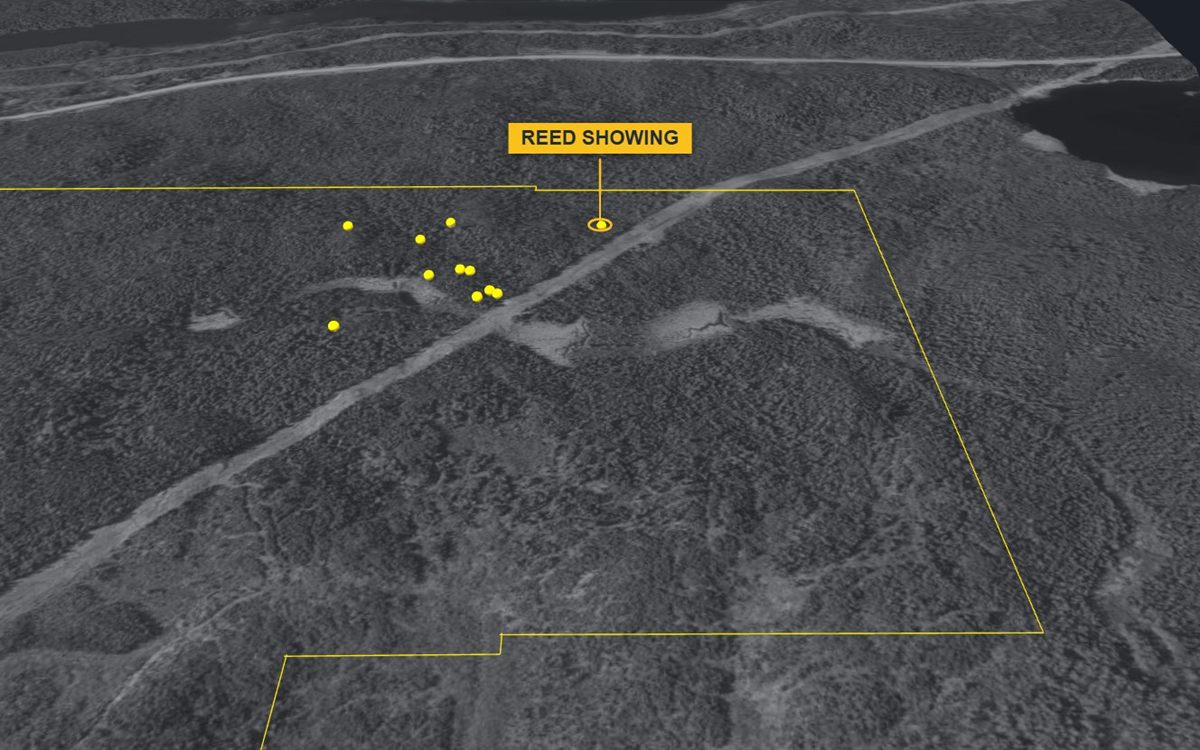
The showing is near the northern edge of the property, in its north-east, in the Kirkland Lake gold camp of north-eastern Ontario.
| UTM (NAD83, zone 17N) | 563861 E, 5327220 N |
|---|---|
| Latitude / longitude | 48.0950° N, 80.1423° W |
| Elevation | 310 m above sea level |
| Townships | Eby / Otto, Larder Lake Mining Division |
| Surveyed | GNSS survey by Surveyors on Site, May 2022 (zero reference point, about ±0.5 m) |
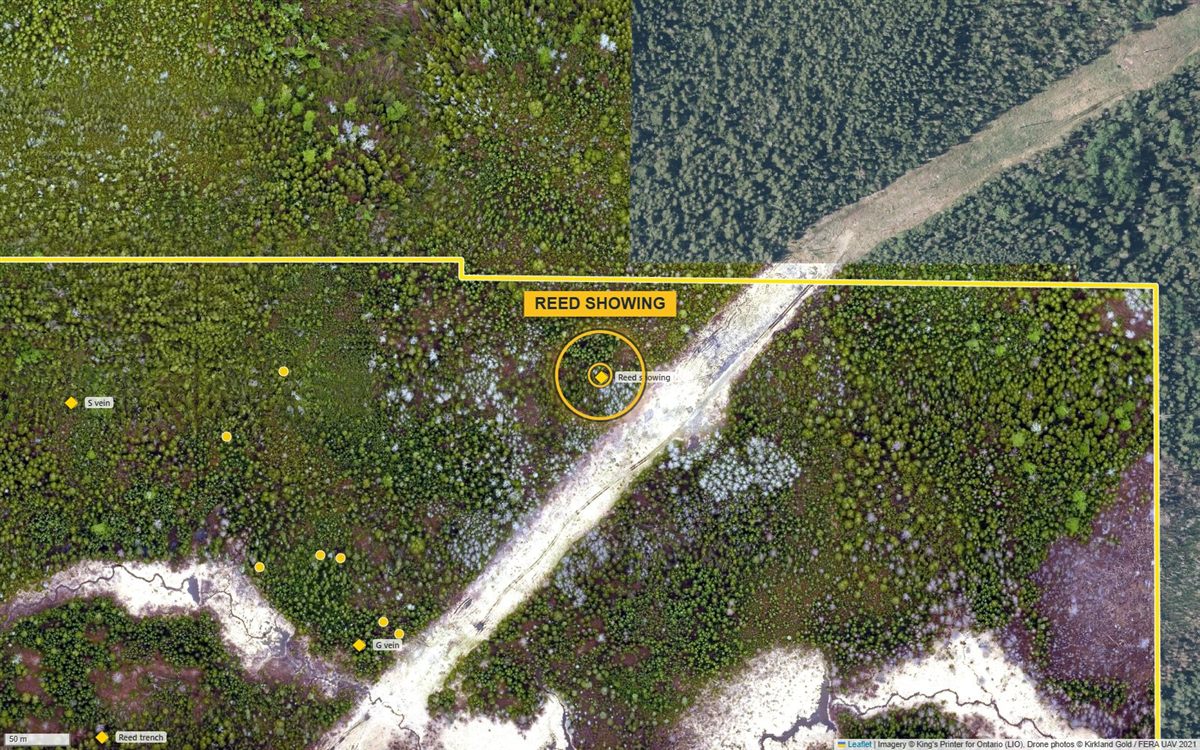
Geology
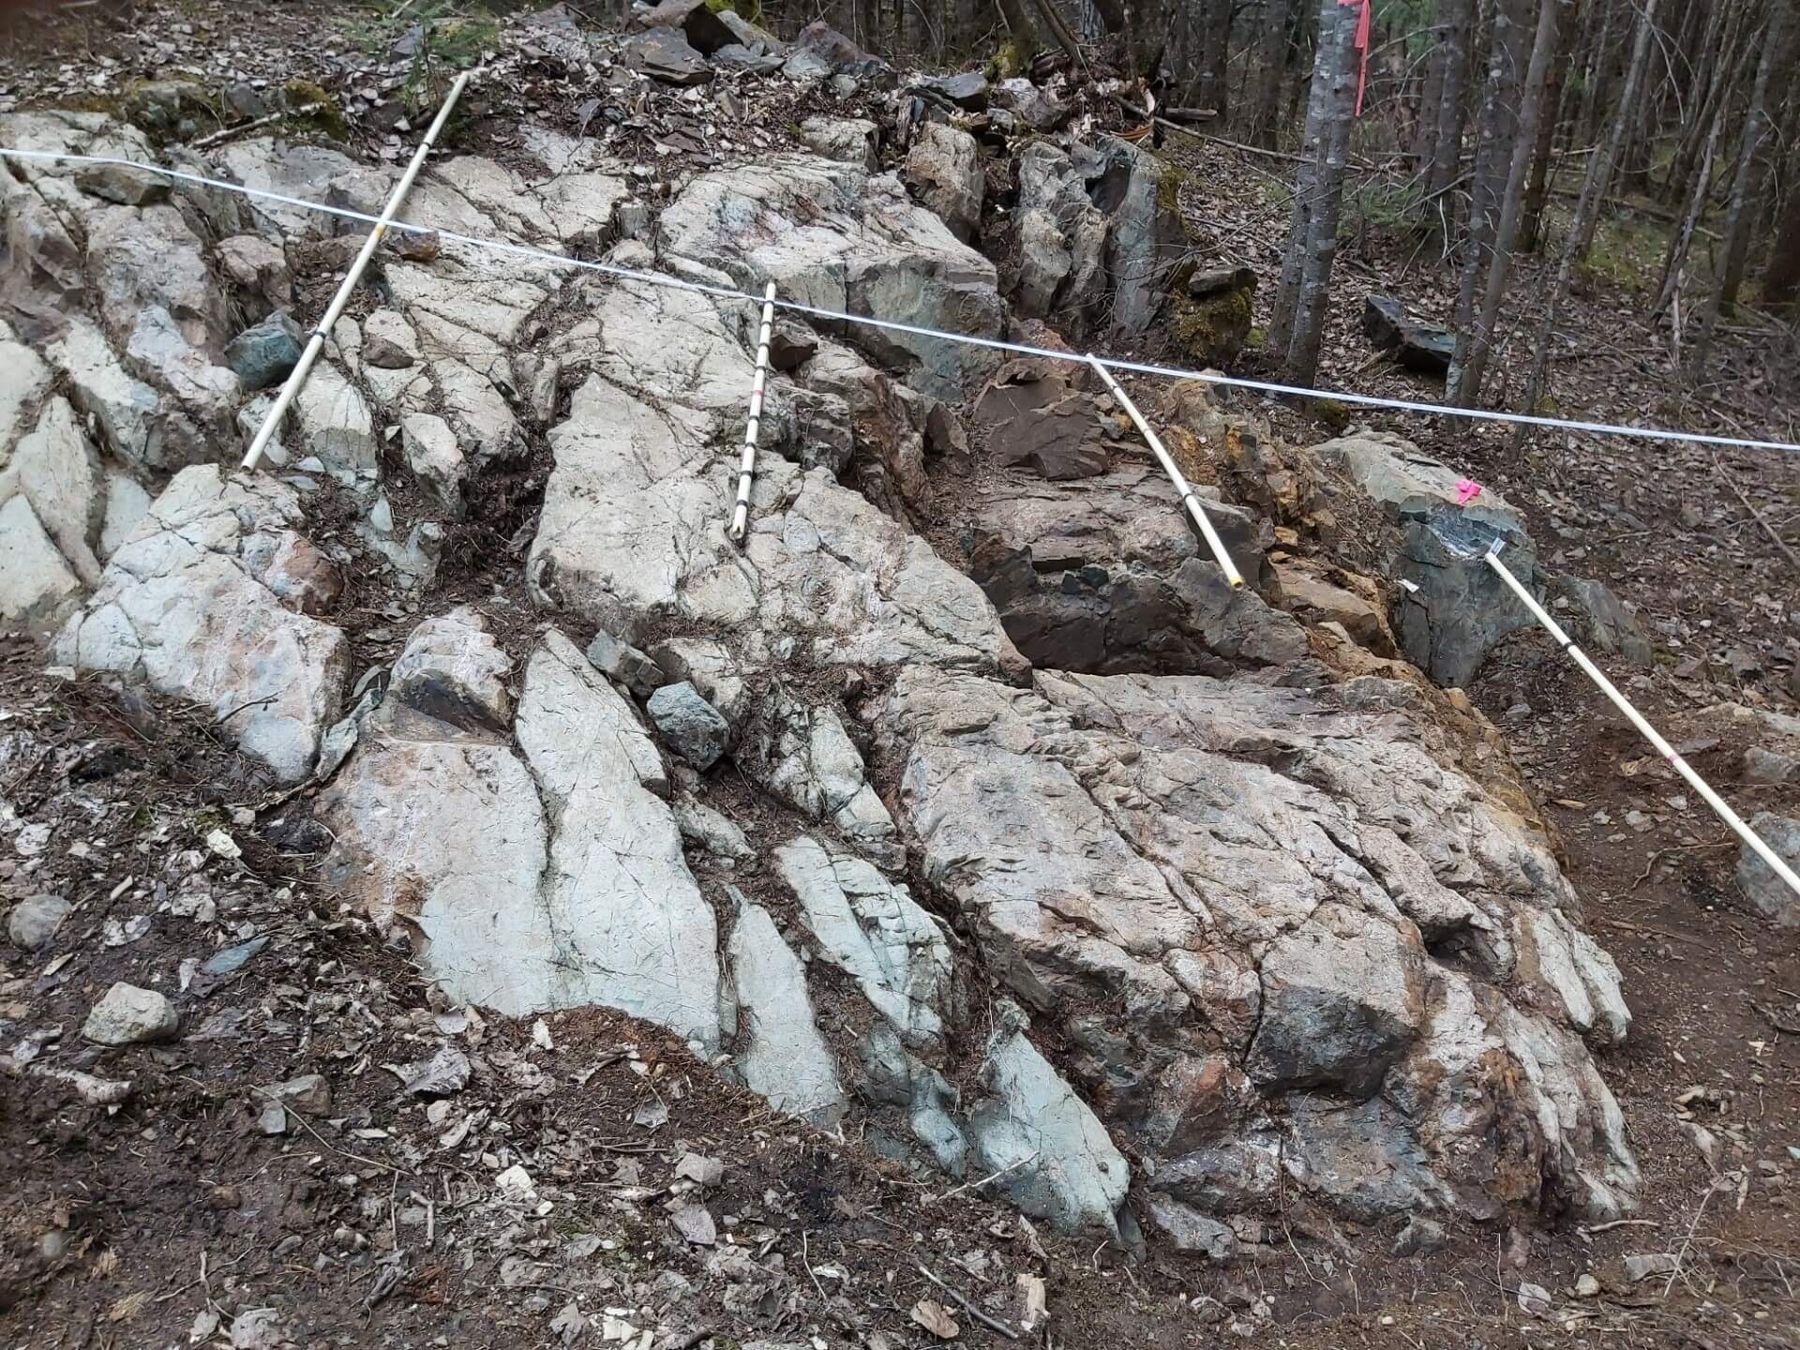
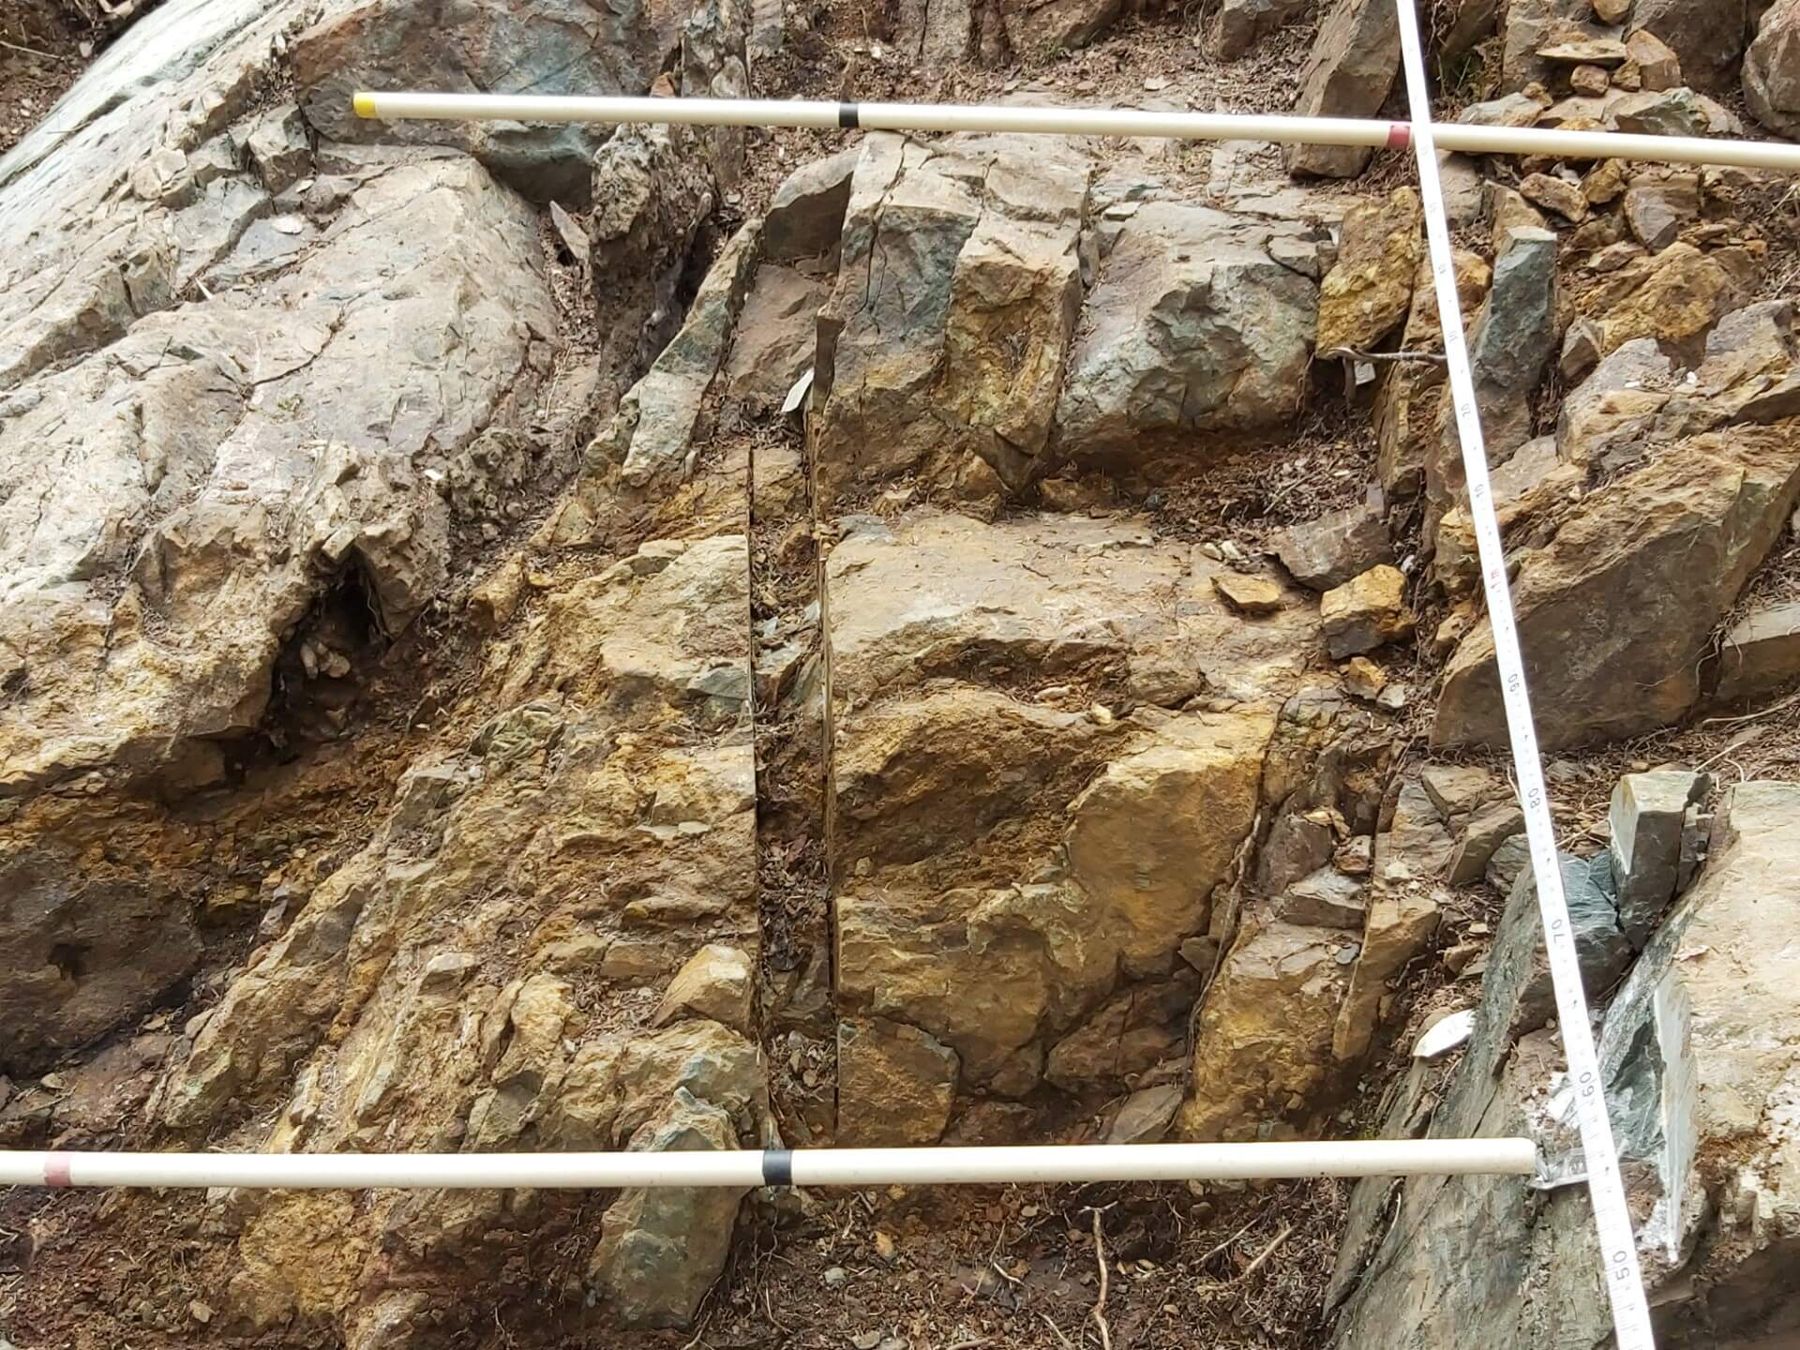
The high-grade zone is an albite replacement zone with more than 5% pyrite, cut by east–west shears. It has a patchy pyritic albite alteration halo grading up to about 1 g Au/mT. A smaller, similar patch of pyrite–albite alteration lies a few metres away. The same patchy pyritic alteration occurs along several of the veins on the property, and appears to form a halo around the Reed showing – a possible vector to high-grade gold.
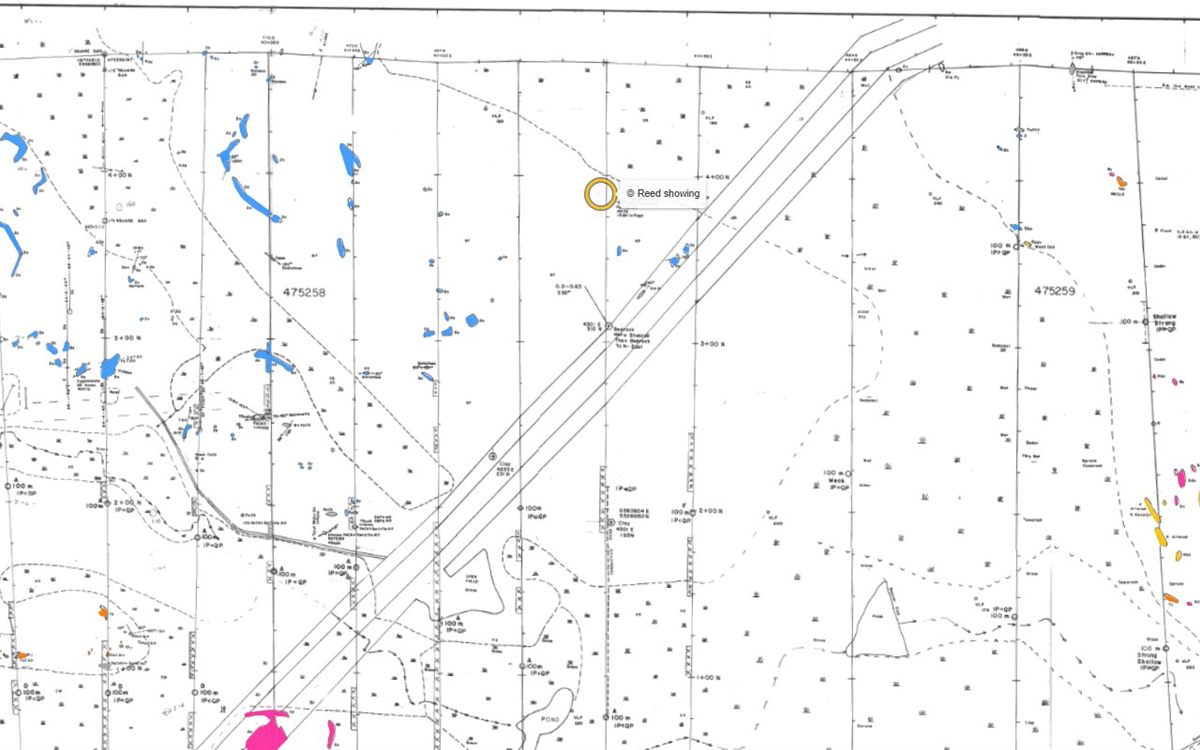
About 14 m² of subcrop were exposed by hand-stripping and washing in 2021 and mapped at 1 cm = 0.25 m.
Sampling
Our best grab sample
19.7 g Au/mT · grab sample
Sample 5967 · rock grab sample from a gossan at the showing · 1994
Assayed by Swastika Laboratories (certificate 4W-2199-RG1, 22 September 1994): 19,749 ppb gold, and 19,954 ppb on the laboratory’s check assay. Submitted by Doug Robinson, P.Eng., and filed with the Ontario ministry in assessment report AFRI 42A01SE0088.
Two results near 20 g Au/mT from the same showing, 23 years apart, by two laboratories.
A grab sample is a selected piece of rock – not representative of the zone. The showing was never drill-tested.

Three samplers · three cuts · the same zone
Three samplers, one zone
The 2017 cut, drawn to scale
Analysed by Activation Laboratories (Actlabs), Swastika laboratory, by fire assay with atomic-absorption finish (report A17-1564, 1 August 2017); the laboratory’s certified standard passed.
Ministry sample (2017)
The Ministry’s resident geologist sampled the showing in 2017: 8.02 g Au/mT over 0.61 m. The result was confirmed by the Ontario Geoscience Laboratories (job 17-0336, certificate CRT-17-0336-01: 0.234 oz/t, duplicate 0.228 oz/t).
Other samples
- 2017: sample 46710, 11.72 g Au/mT
- 1994: grab sample 5967, 19.75 g Au/mT (Swastika Laboratories; public assessment file 42A01SE0088) – the certificate
Every sample on record
Every sample recorded within about 25 m of the showing, from the site’s database:
| Year | Sample | Type | Width | Gold | Description | Report |
|---|---|---|---|---|---|---|
| Loading the samples… | ||||||
Grab samples are selected pieces of rock and are not representative of the zone; channel and cut samples are taken across it.
Please note. Grab, chip and cut samples are selective by nature and may not represent the gold content of the showing as a whole; other samples from the same outcrop have returned much lower values. No resource has been defined on the property. Every result we hold – high and low, with the laboratory certificates and the 2021 channel-sample program – is available to prospective investors in the data room, so that their own qualified person can assess it.
Photos
Click a photo to enlarge it. More photos are on the map’s Photos layer.
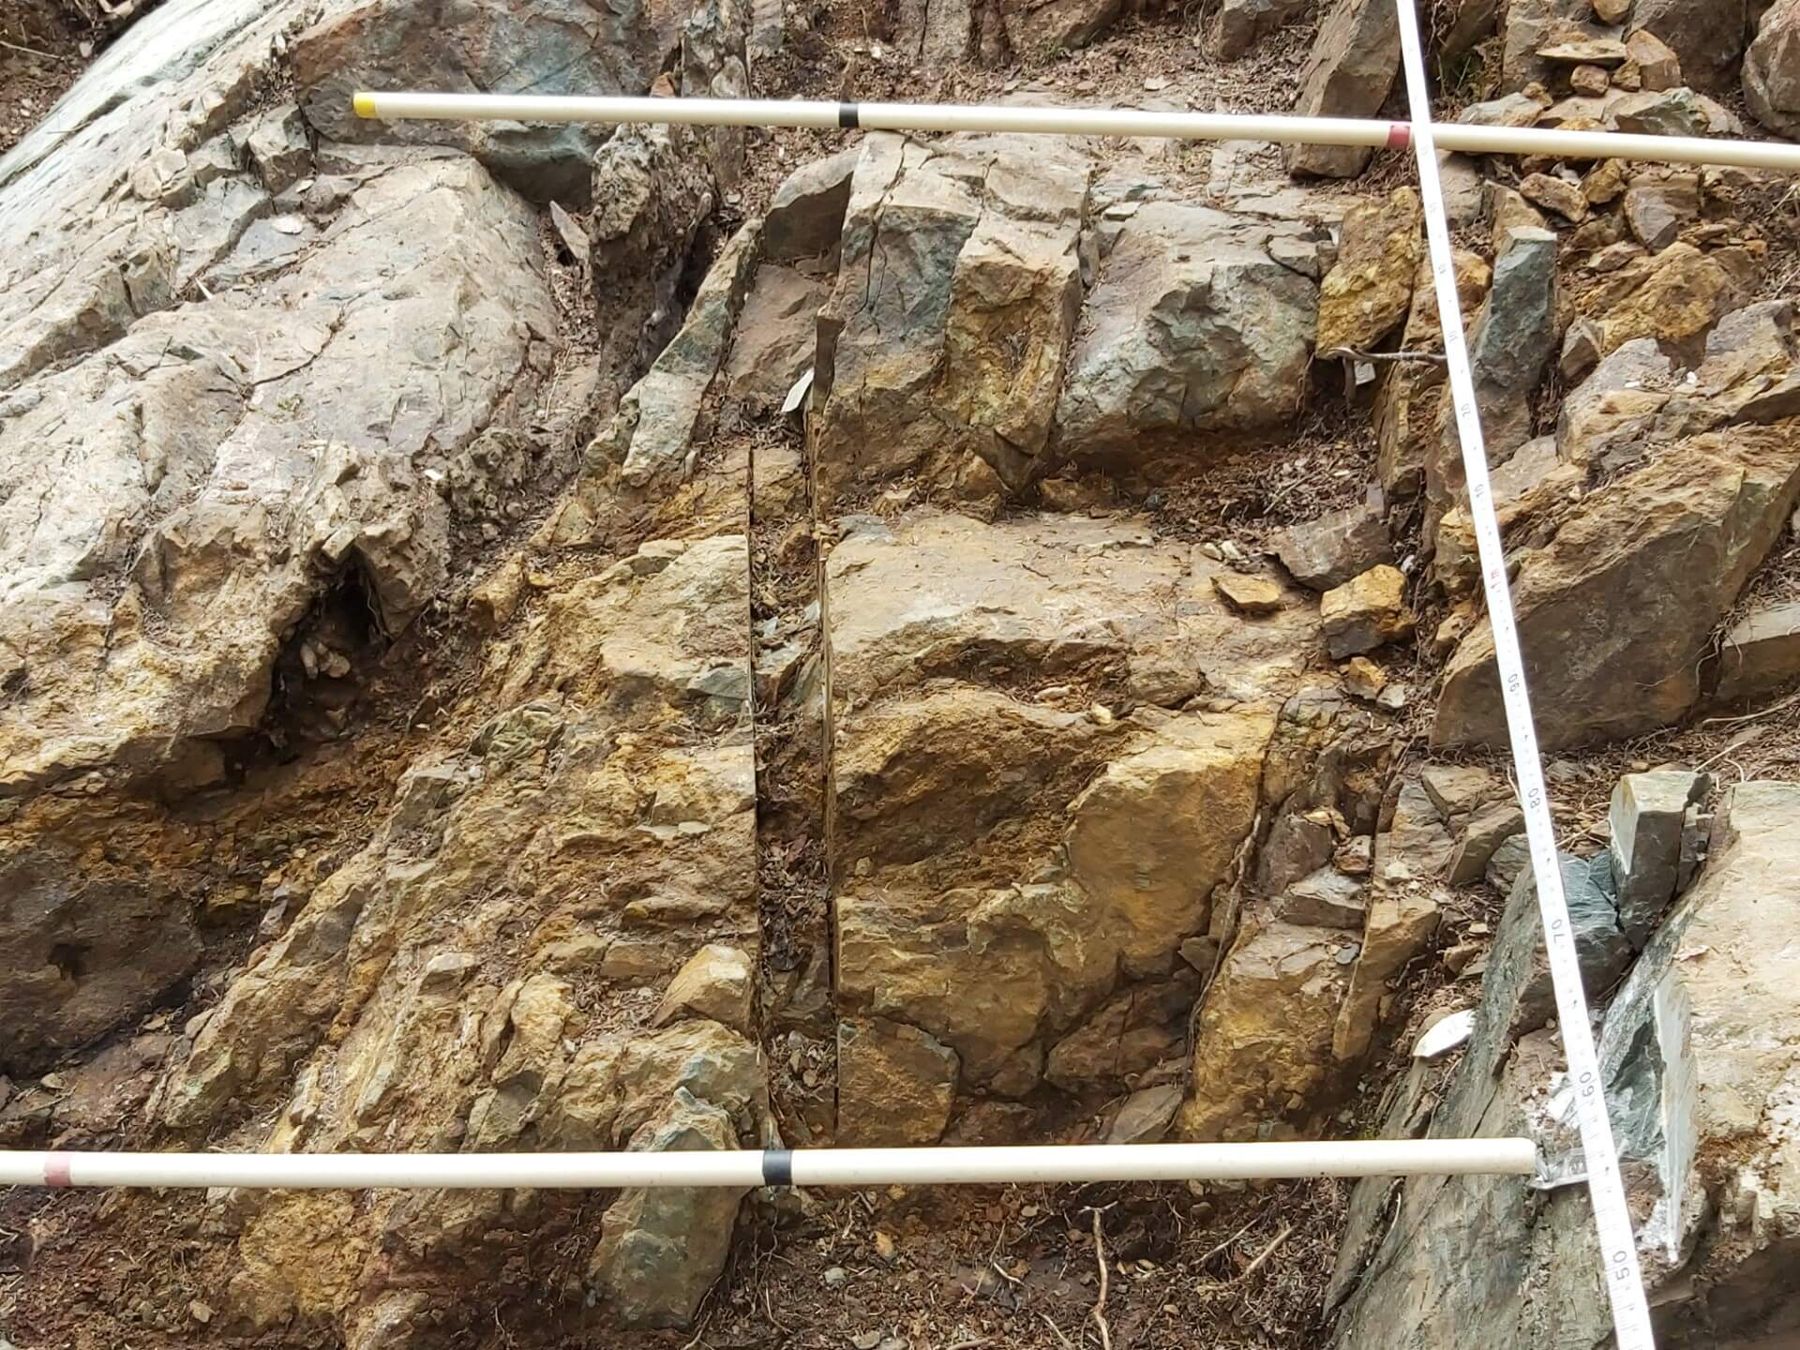
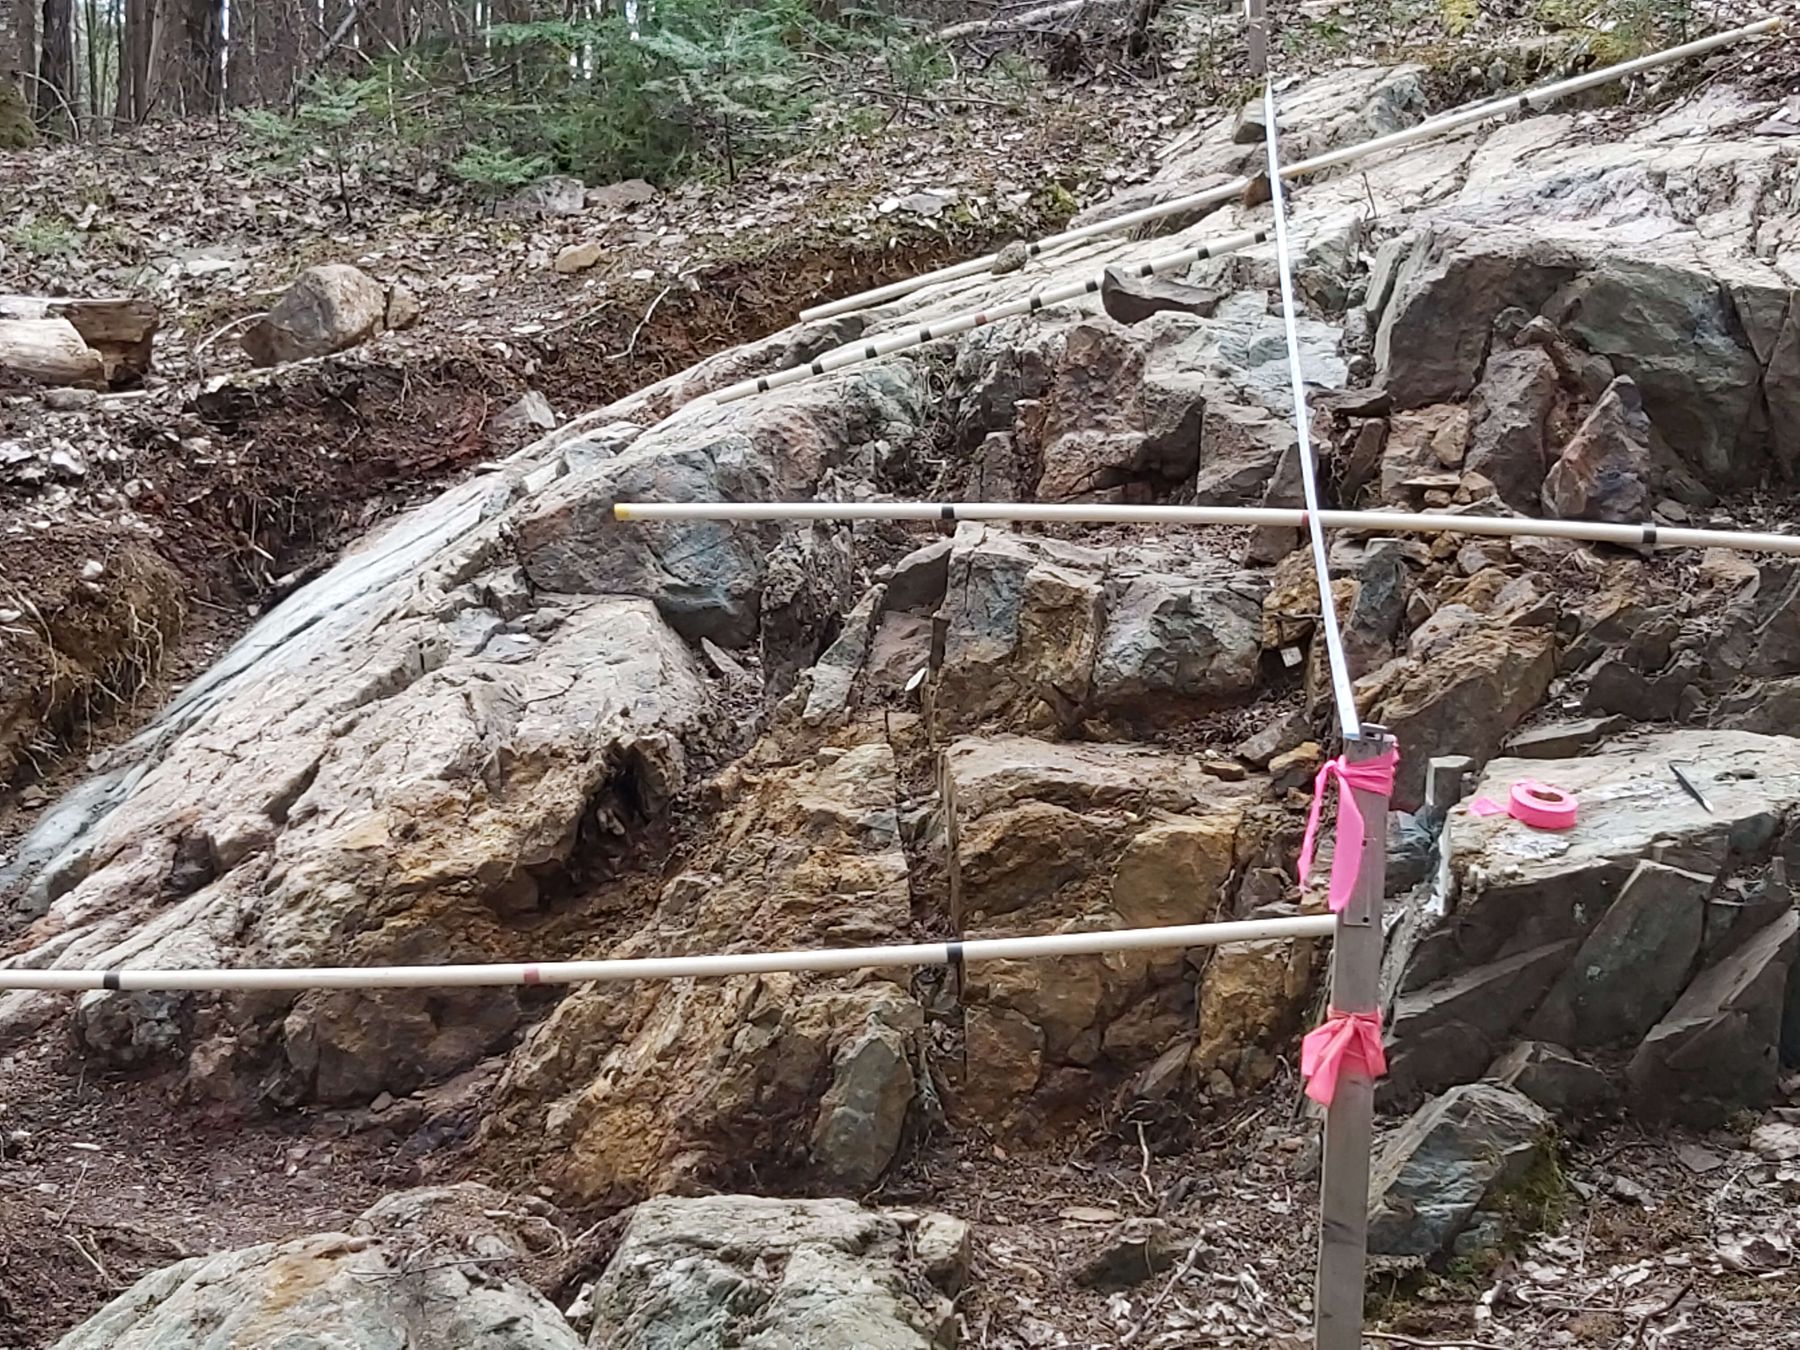
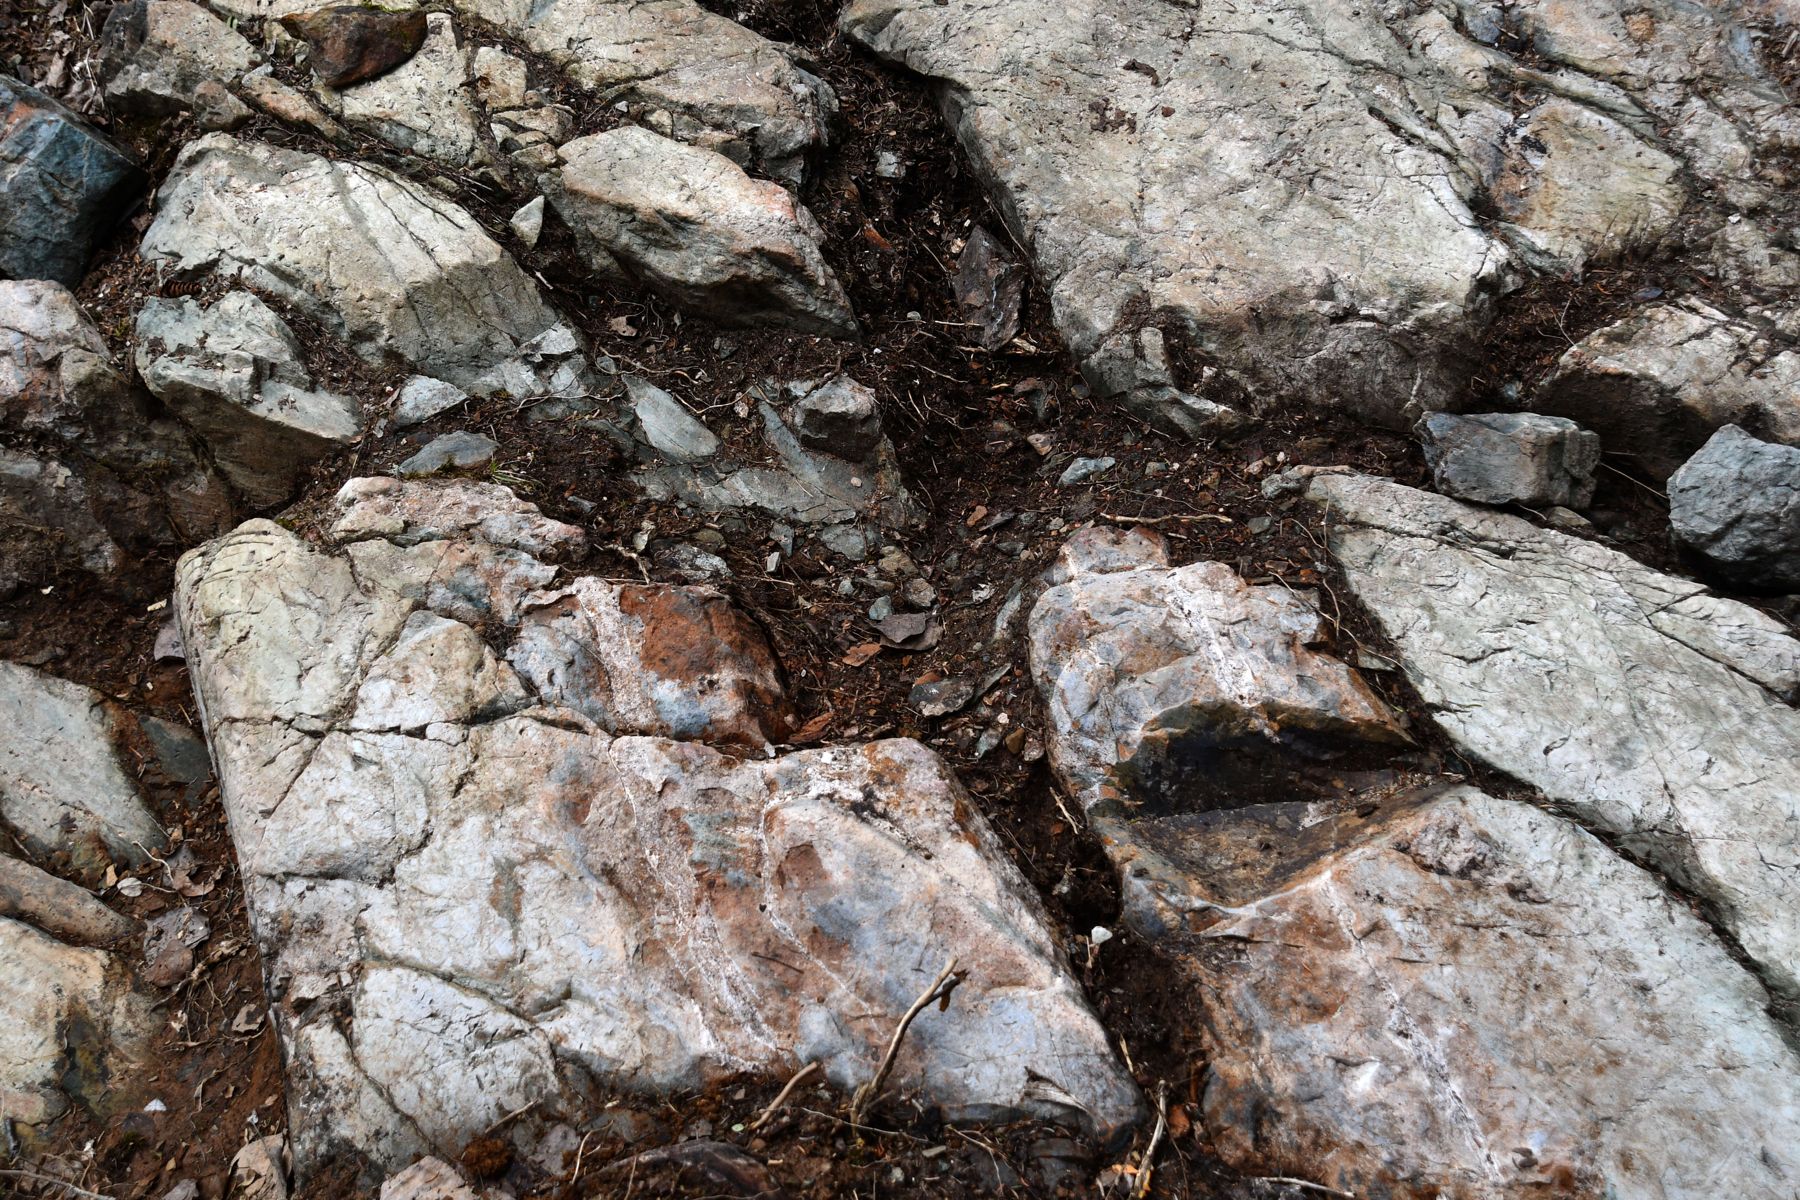
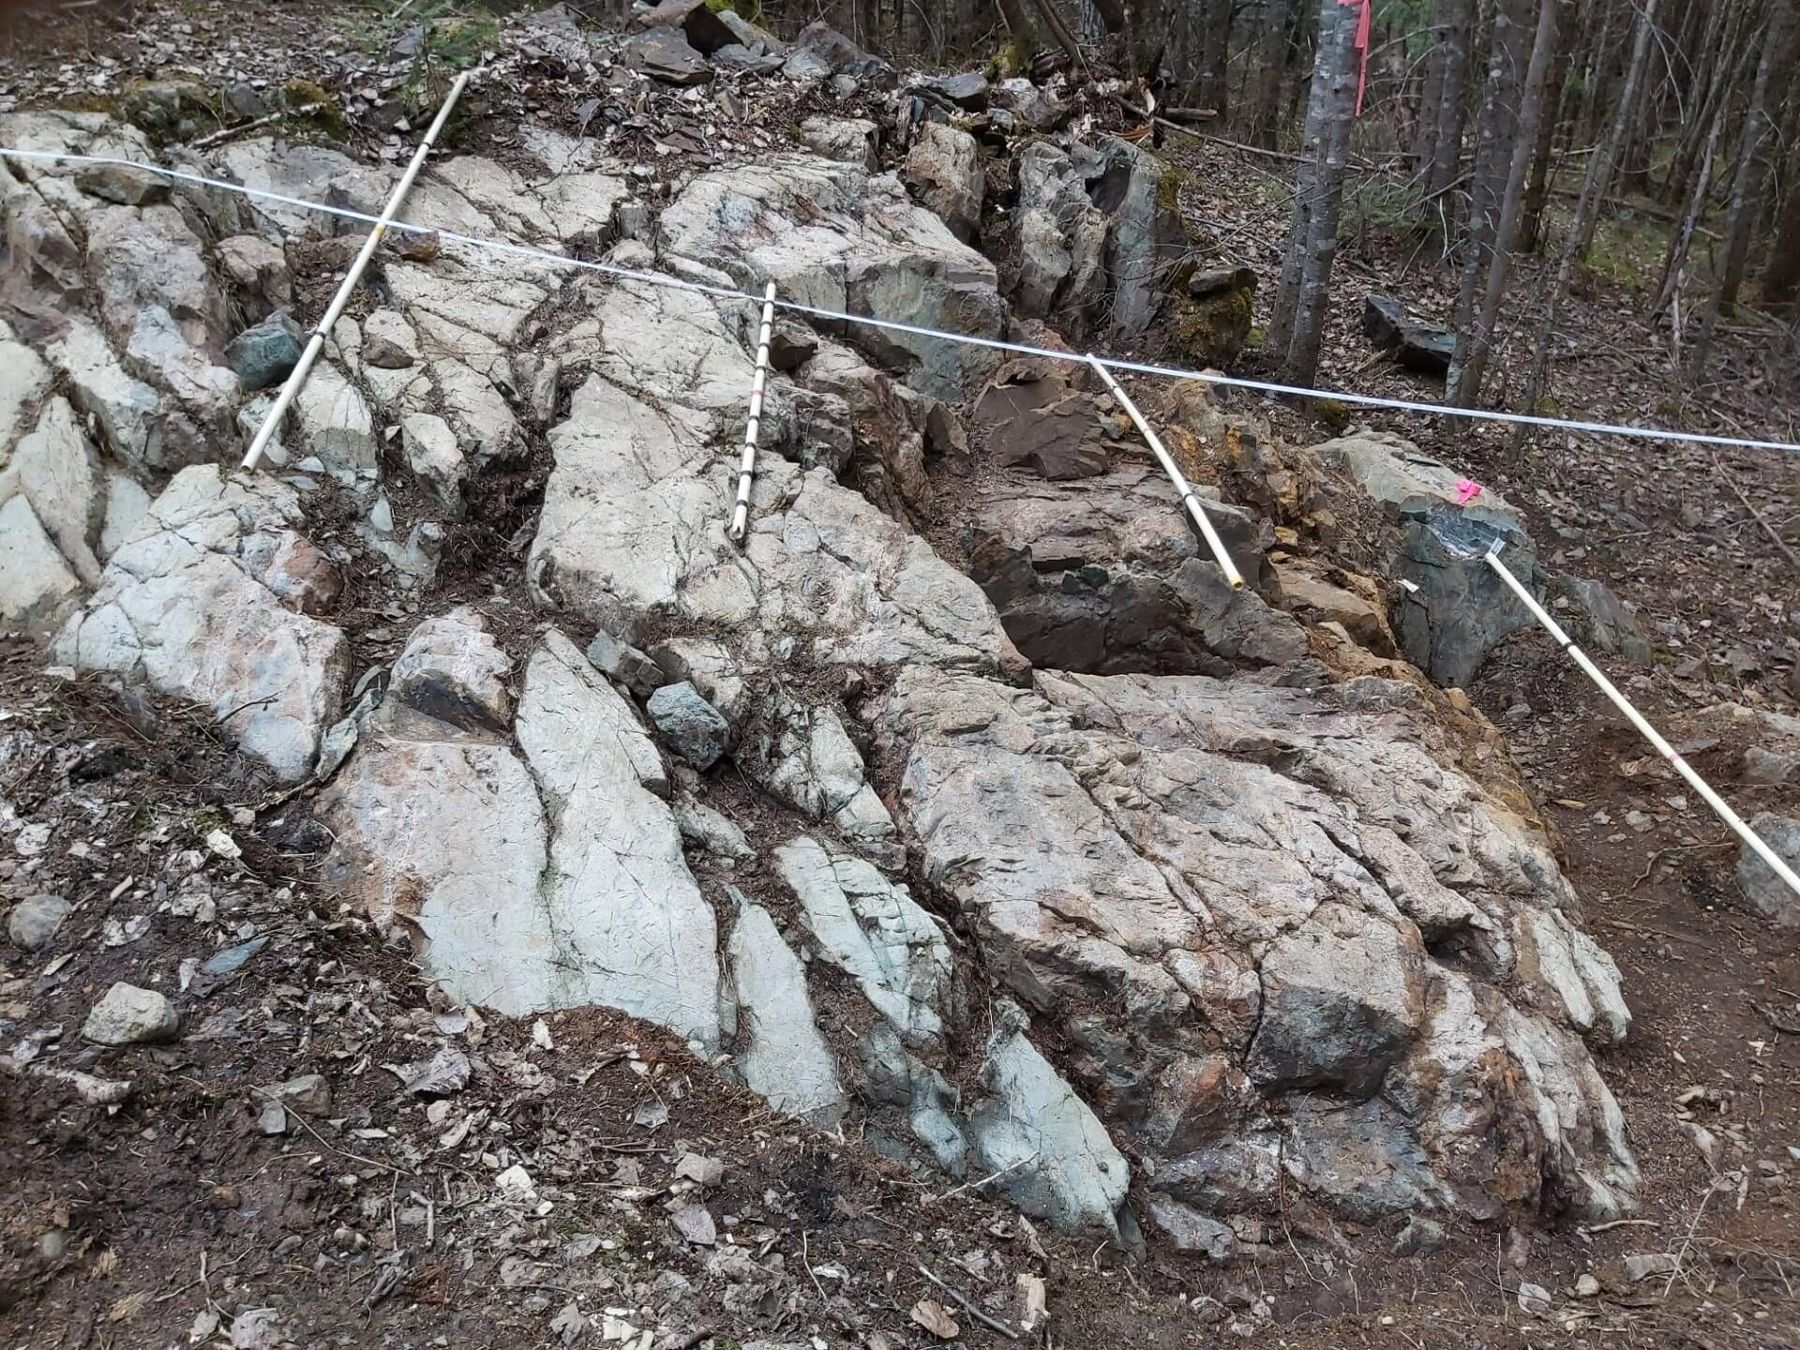
Geophysics
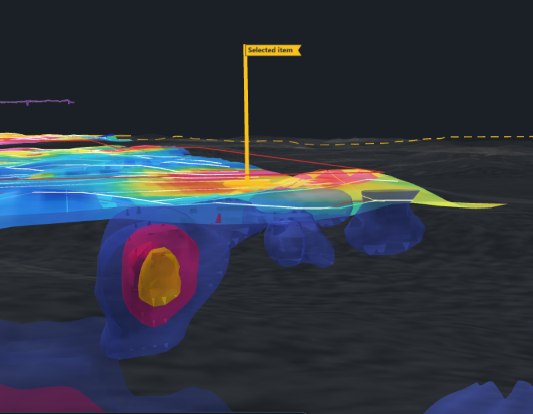
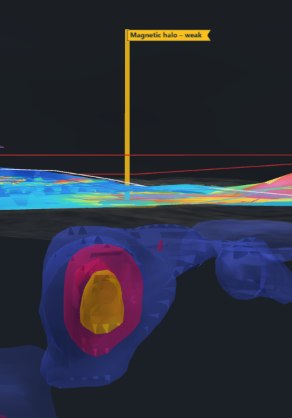
The 2021 Aerial drone magnetic survey shows the showing on the edge of a sharp east-trending magnetic break, with a strong magnetic source beginning right at the showing. Ground magnetic and EM (MaxMin) surveys were run over the Reed grid in 1994–96, and a 3D IP survey over the claims in 2022.

Survey views
The drone magnetics, the 3D magnetic model beneath the showing and the IP survey are in the Property Viewer for investors.
Drilling
The Reed showing was never drill-tested. J. D. Reed’s short 1984 holes (7–36 m) were 616–776 m to the south or on the Highway 11 grid, and EO-22-004 (2022) was collared about 1.8 km to the west; see drilling. The nearest recorded holes, from the site’s database:
| Hole | Year | Company | Length | Distance | Report |
|---|---|---|---|---|---|
| Loading the holes… | |||||
Distances are from the showing to the hole’s collar. All holes: the drilling page.
History
- 1994–95 – the J. Reed group: stripping, EM and magnetic surveys, mapping and assays. A grab sample from a gossan at the showing returned 19.7 g Au/mT (a grab sample – not representative). AFRI 42A01SE0088
- 1994–96 – Doug Robinson, P.Eng.: ground magnetics and EM (MaxMin) over the Reed grid, and 1:1000 geology mapping of the property. AFRI 42A01SE0028 (1995 EM)
- 2016–18 – MMI soil survey over the Reed Robinson property. AFRI 20000015637
- 2017 – rock samples at the showing: 18.82 g Au/mT over 0.20 m, 13.28 g Au/mT and 11.72 g Au/mT.
- 2021 – hand-stripped and washed, mapped in detail and channel-sampled: 1.89 g Au/mT over 1.25 m in the alteration halo. The Aerial drone magnetic survey was flown the same year. AFRI 20000021754, 20000020517
- 2022 – the showing’s reference points surveyed by GNSS (Surveyors on Site), and a 3D IP survey over the claims. AFRI 20000020817
Reports
Assessment reports filed with the Ontario ministry that cover the showing:
- Assessment report, Eby–Otto NE group (J. Reed) AFRI 42A01SE0088 · 1994–95 · Stripping, EM and magnetic surveys, mapping, assays
- Geophysics of the J. Reed group (Doug Robinson) AFRI 42A01SE0028 · 1995 · EM (MaxMin) survey
- MMI soil survey, Reed Robinson property (Doug Robinson, P.Eng.) AFRI 20000015637 · 2016–18 · Soil geochemistry
- Deposit-alteration modelling, 2021 fieldwork, Reed Robinson property (Doug Robinson) AFRI 20000021754 · 2021–23 · Stripping, mapping, channel sampling, magnetic susceptibility
- Aerial drone magnetic survey and 3D inversion, Eby Otto project (EarthEx) AFRI 20000020517 · 2022 · Drone magnetics
- 3D DCIP survey at the Reed-Robinson claims (Dias Geophysical) AFRI 20000020817 · 2022 · Induced polarization
Documents
Signed-in investors also get the library copies of these reports, the survey maps and the data room.
Take the guided tour
The Property Viewer flies to the showing, sets the layers and explains what you are looking at.
Other showings: Reed Trench · G Vein · S Vein ·all showings